3. Tephigram customisation
This section discusses how finer control of the tephigram isobars, saturated adiabats and humidity mixing ratio lines and text can be achieved.
3.1. Isobar control
3.1.1. Isobar lines
The default behaviour of the tephigram isobar line is controlled by the tephi.constants.default["isobar_line"]
dictionary:
>>> print(tephi.constants.default["isobar_line"])
{'color': 'blue', 'linewidth': 0.5, 'clip_on': True}
This is a dictionary of key and value pairs that are passed through as keyword arguments to matplotlib.pyplot.plot().
Updating the tephi.constants.default["isobar_line"] dictionary will subsequently change the default behaviour of
how the tephigram isobar lines are plotted.
import matplotlib.pyplot as plt
import os.path
import tephi
from tephi.constants import default
dew_point = os.path.join(tephi.DATA_DIR, 'dews.txt')
dew_data = tephi.loadtxt(dew_point, column_titles=('pressure', 'dewpoint'))
dews = zip(dew_data.pressure, dew_data.dewpoint)
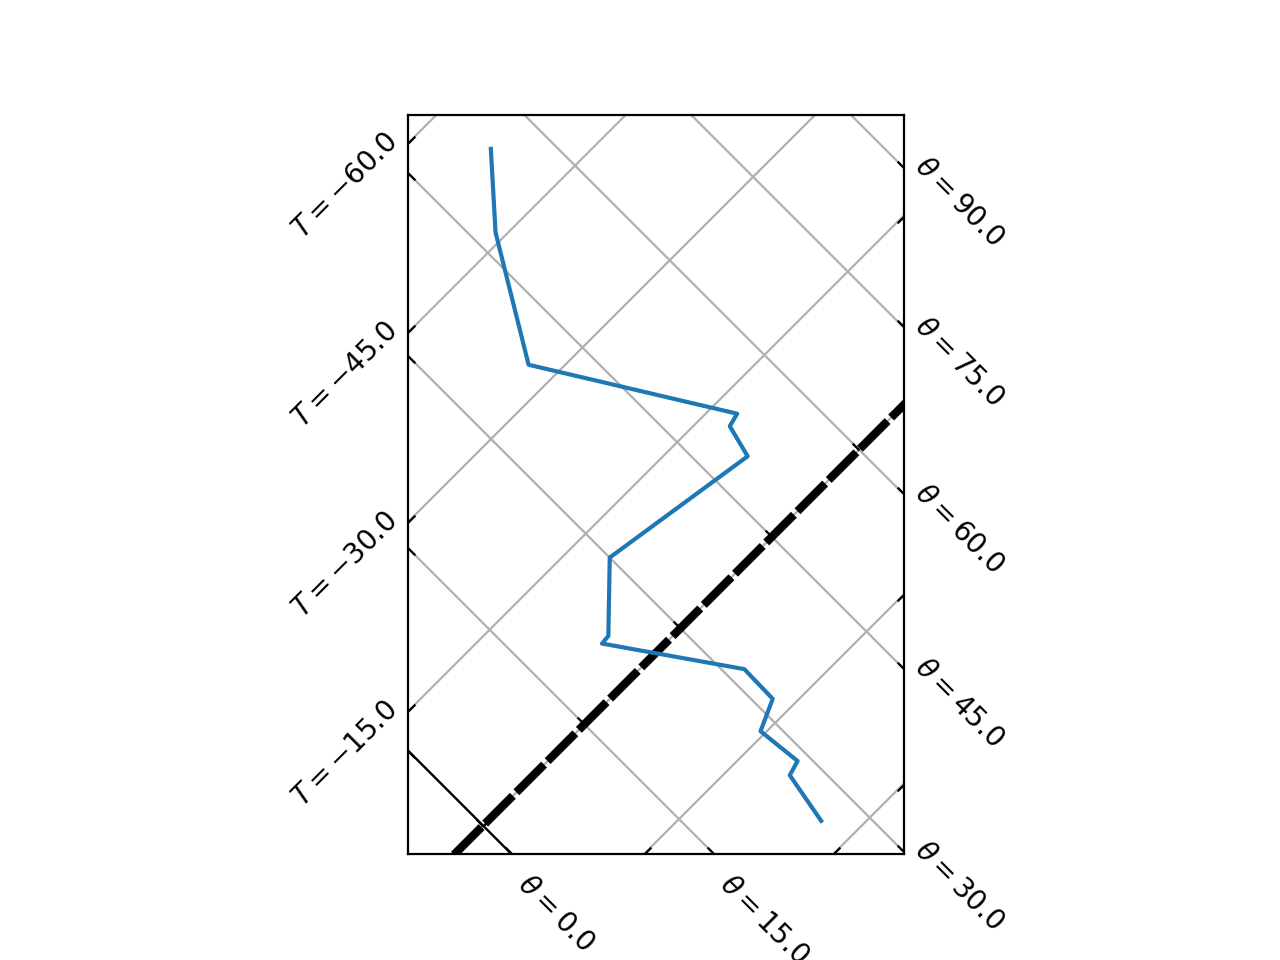
default["isobar_line"].update({'color': 'purple', 'linewidth': 3, 'linestyle': '--'})
tpg = tephi.TephiAxes()
tpg.plot(dews)
plt.show()
(Source code, png, hires.png, pdf)

3.1.2. Isobar text
Similarly, the default behaviour of the tephigram isobar text is controlled by the
tephi.constants.default["isobar_text"] dictionary:
>>> pprint(tephi.constants.default["isobar_text"])
{'clip_on': True, 'color': 'blue', 'ha': 'right', 'size': 8, 'va': 'bottom'}
This is a dictionary of key and value pairs that are passed through as keyword arguments to matplotlib.pyplot.text().
Updating the tephi.constants.default["isobar_text"] dictionary will change the default behaviour of how the
tephigram isobar text is plotted.
import matplotlib.pyplot as plt
import os.path

import tephi
from tephi.constants import default

dew_point = os.path.join(tephi.DATA_DIR, 'dews.txt')
dew_data = tephi.loadtxt(dew_point, column_titles=('pressure', 'dewpoint'))
dews = zip(dew_data.pressure, dew_data.dewpoint)
default["isobar_text"].update({'color': 'purple', 'size': 12})
tpg = tephi.TephiAxes()
tpg.plot(dews)
plt.show()
(Source code, png, hires.png, pdf)

3.1.3. Isobar frequency
The values at which isobars lines can be created is controlled by the
tephi.constants.default["isobar_ticks"] value:
>>> print(tephi.constants.default["isobar_ticks"])
[1050, 1000, 950, 900, 850, 800, 700, 600, 500, 400, 300, 250, 200, 150, 100, 70, 50, 40, 30, 20, 10]
The frequency at which isobar lines are plotted on the tephigram is controlled by the
tephi.constants.default["isobar_nbins"] value:
>>> print(tephi.constants.default["isobar_nbins"])
None
nbins controls the maximum number of lines plotted at one time. It can either be an integer value, or a None
value, which means that a line will be shown for every tick in tephi.constants.default["isobar_ticks"].
import matplotlib.pyplot as plt
import os.path

import tephi
from tephi.constants import default

dew_point = os.path.join(tephi.DATA_DIR, 'dews.txt')
dew_data = tephi.loadtxt(dew_point, column_titles=('pressure', 'dewpoint'))
dews = zip(dew_data.pressure, dew_data.dewpoint)
default["isobar_ticks"] = [900, 875, 850]
default["isobar_nbins"] = 2
tpg = tephi.TephiAxes()
tpg.plot(dews)
plt.show()
(Source code, png, hires.png, pdf)

3.1.4. Isobar line extent
The extent of each tephigram isobar line is controlled by the tephi.constants.default["isobar_min_theta"] and
tephi.constants.default["isobar_max_theta"] variables:
>>> print(tephi.constants.default["isobar_min_theta"])
0
>>> print(tephi.constants.default["isobar_max_theta"])
250
For example, to change the isobar line extent behaviour to be between 15 oC and 60 oC,
import matplotlib.pyplot as plt
import os.path

import tephi
from tephi.constants import default

dew_point = os.path.join(tephi.DATA_DIR, 'dews.txt')
dew_data = tephi.loadtxt(dew_point, column_titles=('pressure', 'dewpoint'))
dews = zip(dew_data.pressure, dew_data.dewpoint)
default["isobar_min_theta"] = 15
default["isobar_max_theta"] = 60
tpg = tephi.TephiAxes()
tpg.plot(dews)
plt.show()
(Source code, png, hires.png, pdf)

3.2. Saturated adiabat control
3.2.1. Saturated adiabat lines
The values at which pseudo saturated adiabat lines can be created is controlled by the
tephi.constants.default["wet_adiabat_line"] dictionary:
>>> print(tephi.constants.default["wet_adiabat_line"])
{'color': 'orange', 'linewidth': 0.5, 'clip_on': True}
This is a dictionary of key and value pairs that are passed through as keyword arguments to matplotlib.pyplot.plot().
Updating the default["wet_adiabat_line"] dictionary will change the default behaviour of all saturated adiabat line plotting.
import matplotlib.pyplot as plt
import os.path

import tephi
from tephi.constants import default

dew_point = os.path.join(tephi.DATA_DIR, 'dews.txt')
dew_data = tephi.loadtxt(dew_point, column_titles=('pressure', 'dewpoint'))
dews = zip(dew_data.pressure, dew_data.dewpoint)
default["wet_adiabat_line"].update({'color': 'purple', 'linewidth': 3, 'linestyle': '--'})
tpg = tephi.TephiAxes()
tpg.plot(dews)
plt.show()
(Source code, png, hires.png, pdf)

3.2.2. Saturated adiabat text
The default behaviour of the tephigram saturated adiabat text is controlled by the
tephi.constants.default["wet_adiabat_text"] dictionary:
>>> pprint(tephi.constants.default["wet_adiabat_text"])
{'clip_on': True, 'color': 'orange', 'ha': 'left', 'size': 8, 'va': 'top'}
This is a dictionary of key and value pairs that are passed through as keyword arguments to matplotlib.pyplot.text().
Updating the default["wet_adiabat_text"] dictionary will change the default behaviour of how the text of associated saturated adiabat lines are plotted.
import matplotlib.pyplot as plt
import os.path

import tephi
from tephi.constants import default

dew_point = os.path.join(tephi.DATA_DIR, 'dews.txt')
dew_data = tephi.loadtxt(dew_point, column_titles=('pressure', 'dewpoint'))
dews = zip(dew_data.pressure, dew_data.dewpoint)
default["wet_adiabat_text"].update({'color': 'purple', 'size': 12})
tpg = tephi.TephiAxes()
tpg.plot(dews)
plt.show()
(Source code, png, hires.png, pdf)

3.2.3. Saturated adiabat line frequency
The values at which pseudo saturated adiabat lines can be created is controlled by the
tephi.constants.default["wet_adiabat_ticks"] value:
>>> print(tephi.constants.default["wet_adiabat_ticks"])
range(1, 61)
The frequency at which wet adiabat lines are plotted on the tephigram is controlled by the
tephi.constants.default["wet_adiabat_nbins"] value:
>>> print(tephi.constants.default["wet_adiabat_nbins"])
10
nbins controls the maximum number of lines plotted at one time. It can either be an integer value, or a None
value, which means that a line will be shown for every tick in tephi.constants.default["wet_adiabat_ticks"].
3.2.4. Saturated Adiabat Extents
The extent of each tephigram saturated adiabat line is controlled by the
tephi.constants.default["wet_adiabat_min_temperature"] and
tephi.constants.default["wet_adiabat_max_pressure"] variables:
>>> print(tephi.constants.default["wet_adiabat_min_temperature"])
-50
>>> print(tephi.constants.default["wet_adiabat_max_pressure"])
1000.0
For example, to change the wet adiabat line extent behaviour to be between -10 oC and 900 mbar,
import matplotlib.pyplot as plt
import os.path

import tephi
from tephi.constants import default

dew_point = os.path.join(tephi.DATA_DIR, 'dews.txt')
dew_data = tephi.loadtxt(dew_point, column_titles=('pressure', 'dewpoint'))
dews = zip(dew_data.pressure, dew_data.dewpoint)
default["wet_adiabat_min_temperature"] = -10
default["wet_adiabat_max_pressure"] = 900
tpg = tephi.TephiAxes()
tpg.plot(dews)
plt.show()
(Source code, png, hires.png, pdf)

3.3. Humidity mixing ratio control
3.3.1. Humidity mixing ratio lines
The default behaviour of the tephigram humidity mixing ratio line is controlled by the
tephi.constants.default["mixing_ratio_line"] dictionary:
>>> print(tephi.constants.default["mixing_ratio_line"])
{'color': 'green', 'linewidth': 0.5, 'clip_on': True}
This is a dictionary of key and value pairs that are passed through as keyword arguments to matplotlib.pyplot.plot().
Updating the default["mixing_ratio_line"] dictionary will change the default behaviour of all humidity mixing ratio line plotting.
import matplotlib.pyplot as plt
import os.path

import tephi
from tephi.constants import default

dew_point = os.path.join(tephi.DATA_DIR, 'dews.txt')
dew_data = tephi.loadtxt(dew_point, column_titles=('pressure', 'dewpoint'))
dews = zip(dew_data.pressure, dew_data.dewpoint)
default["mixing_ratio_line"].update({'color': 'purple', 'linewidth': 3, 'linestyle': '--'})
tpg = tephi.TephiAxes()
tpg.plot(dews)
plt.show()
(Source code, png, hires.png, pdf)

3.3.2. Humidity mixing ratio text
The default behaviour of the tephigram humidity mixing ratio text is controlled by the
tephi.constants.default["mixing_ratio_text"] dictionary:
>>> pprint(tephi.constants.default["mixing_ratio_text"])
{'clip_on': True, 'color': 'green', 'ha': 'right', 'size': 8, 'va': 'bottom'}
This is a dictionary of key and value pairs that are passed through as keyword arguments to matplotlib.pyplot.text().
Updating the default["mixing_ratio_text"] dictionary will change the default behaviour of how the text of associated
humidity mixing ratio lines are plotted.
import matplotlib.pyplot as plt
import os.path

import tephi
from tephi.constants import default

dew_point = os.path.join(tephi.DATA_DIR, 'dews.txt')
dew_data = tephi.loadtxt(dew_point, column_titles=('pressure', 'dewpoint'))
dews = zip(dew_data.pressure, dew_data.dewpoint)
default["mixing_ratio_text"].update({'color': 'purple', 'size': 12})
tpg = tephi.TephiAxes()
tpg.plot(dews)
plt.show()
(Source code, png, hires.png, pdf)

3.3.3. Mixing Ratio line frequency
The values at which mixing ratio lines can be created is controlled by the
tephi.constants.default["mixing_ratio_ticks"] value:
>>> print(tephi.constants.default["mixing_ratio_ticks"])
[0.001, 0.002, 0.005, 0.01, 0.02, 0.03, 0.05, 0.1, 0.15, 0.2, 0.3, 0.4, 0.5, 0.6, 0.8, 1.0, 1.5, 2.0, 2.5, 3.0, 4.0, 5.0, 6.0, 7.0, 8.0, 9.0, 10.0, 12.0, 14.0, 16.0, 18.0, 20.0, 24.0, 28.0, 32.0, 36.0, 40.0, 44.0, 48.0, 52.0, 56.0, 60.0, 68.0, 80.0]
The frequency at which mixing ratio lines are plotted on the tephigram is controlled by the
tephi.constants.default["mixing_ratio_nbins"] value:
>>> print(tephi.constants.default["mixing_ratio_nbins"])
10
nbins controls the maximum number of lines plotted at one time. It can either be an integer value, or a None
value, which means that a line will be shown for every tick in tephi.constants.default["mixing_ratio_ticks"].
3.3.4. Mixing Ratio Extents
The extent of each tephigram mixing ratio line is controlled by the
tephi.constants.default["mixing_ratio_min_pressure"] and
tephi.constants.default["mixing_ratio_max_pressure"] variables:
>>> print(tephi.constants.default["mixing_ratio_min_pressure"])
10
>>> print(tephi.constants.default["mixing_ratio_max_pressure"])
1000.0
For example, to change the wet adiabat line extent behaviour to be between 100 mbar and 500 mbar,
import matplotlib.pyplot as plt
import os.path

import tephi
from tephi.constants import default

dew_point = os.path.join(tephi.DATA_DIR, 'dews.txt')
dew_data = tephi.loadtxt(dew_point, column_titles=('pressure', 'dewpoint'))
dews = zip(dew_data.pressure, dew_data.dewpoint)
default["mixing_ratio_min_pressure"] = 100
default["mixing_ratio_max_pressure"] = 500
tpg = tephi.TephiAxes()
tpg.plot(dews)
plt.show()
(Source code, png, hires.png, pdf)
