Tephi reference documentation
The tephi module provides tephigram plotting of pressure, temperature and wind barb data.
Warning
This is a beta release module and is liable to change.
In this module:
-
tephi.loadtxt(*filenames, **kwargs)¶ Load one or more text files of pressure, temperature, wind speed and wind direction value sets.
Each line should contain, at minimum, a single pressure value (mb or hPa), and a single temperature value (degC), but may also contain a dewpoint value (degC), wind speed (knots) and wind direction value (degrees from north).
Note that blank lines and comment lines beginning with a ‘#’ are ignored.
For example:
>>> import os.path
>>> import tephi
>>> winds = os.path.join(tephi.DATA_DIR, 'barbs.txt')
>>> columns = ('pressure', 'dewpoint', 'wind_speed', 'wind_direction')
>>> data = tephi.loadtxt(winds, column_titles=columns)
>>> pressure = data.pressure
>>> dews = data.dewpoint
>>> wind_speed = data.wind_speed
>>> wind_direction = data.wind_direction
See also
Args:
filenames: one or more filenames.
Kwargs:
- column_titles:
List of iterables, or None. If specified, should contain one title string for each column of data per specified file. If all of multiple files loaded have the same column titles, then only one tuple of column titles need be specified.
- delimiter:
The string used to separate values. This is passed directly to
np.loadtxt(), which defaults to using any whitespace as delimiter if this keyword is not specified.
- dtype:
The datatype to cast the data in the text file to. Passed directly to
np.loadtxt().
- Returns:
A
collections.namedtuple()instance containing one tuple, named with the relevant column title if specified, for each column of data in the text file loaded. If more than one file is loaded, a sequence of namedtuples is returned.
Determine the fixed step axis tick locations when called with a tick range.
- class
tephi.Locator(step)¶Determine the fixed step axis tick locations when called with a tick range.
Generate a tephigram of one or more pressure and temperature data sets.
- class
tephi.Tephigram(figure=None, isotherm_locator=None, dry_adiabat_locator=None, anchor=None)¶Generate a tephigram of one or more pressure and temperature data sets.
plot(data, **kwargs)¶Plot the environmental lapse rate profile of the pressure and temperature data points.
The pressure and temperature data points are transformed into potential temperature and temperature data points before plotting.
By default, the tephigram will automatically center the plot around all profiles.
Warning
Pressure data points must be in units of mb or hPa, and temperature data points must be in units of degC.
Args:
data: pressure and temperature pair data points.
Note
All keyword arguments are passed through to
matplotlib.pyplot.plot().For example:
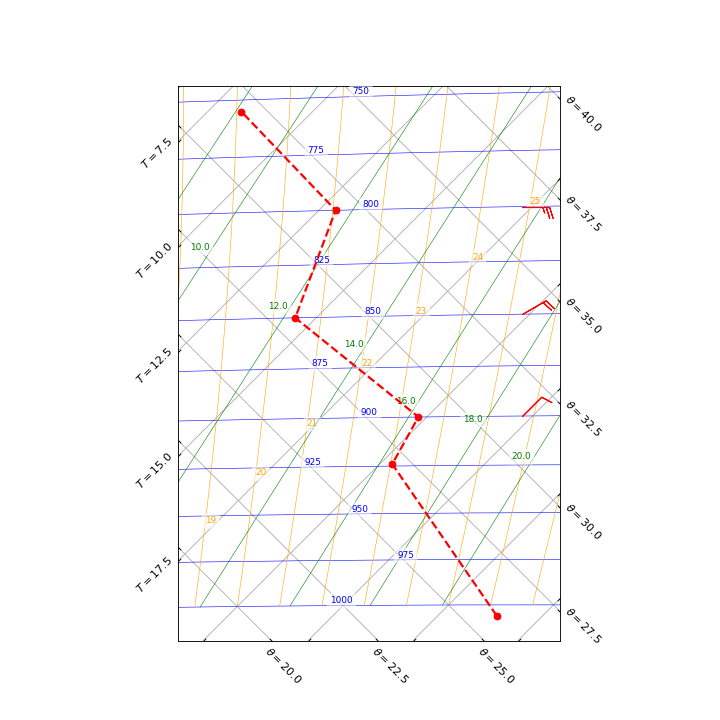
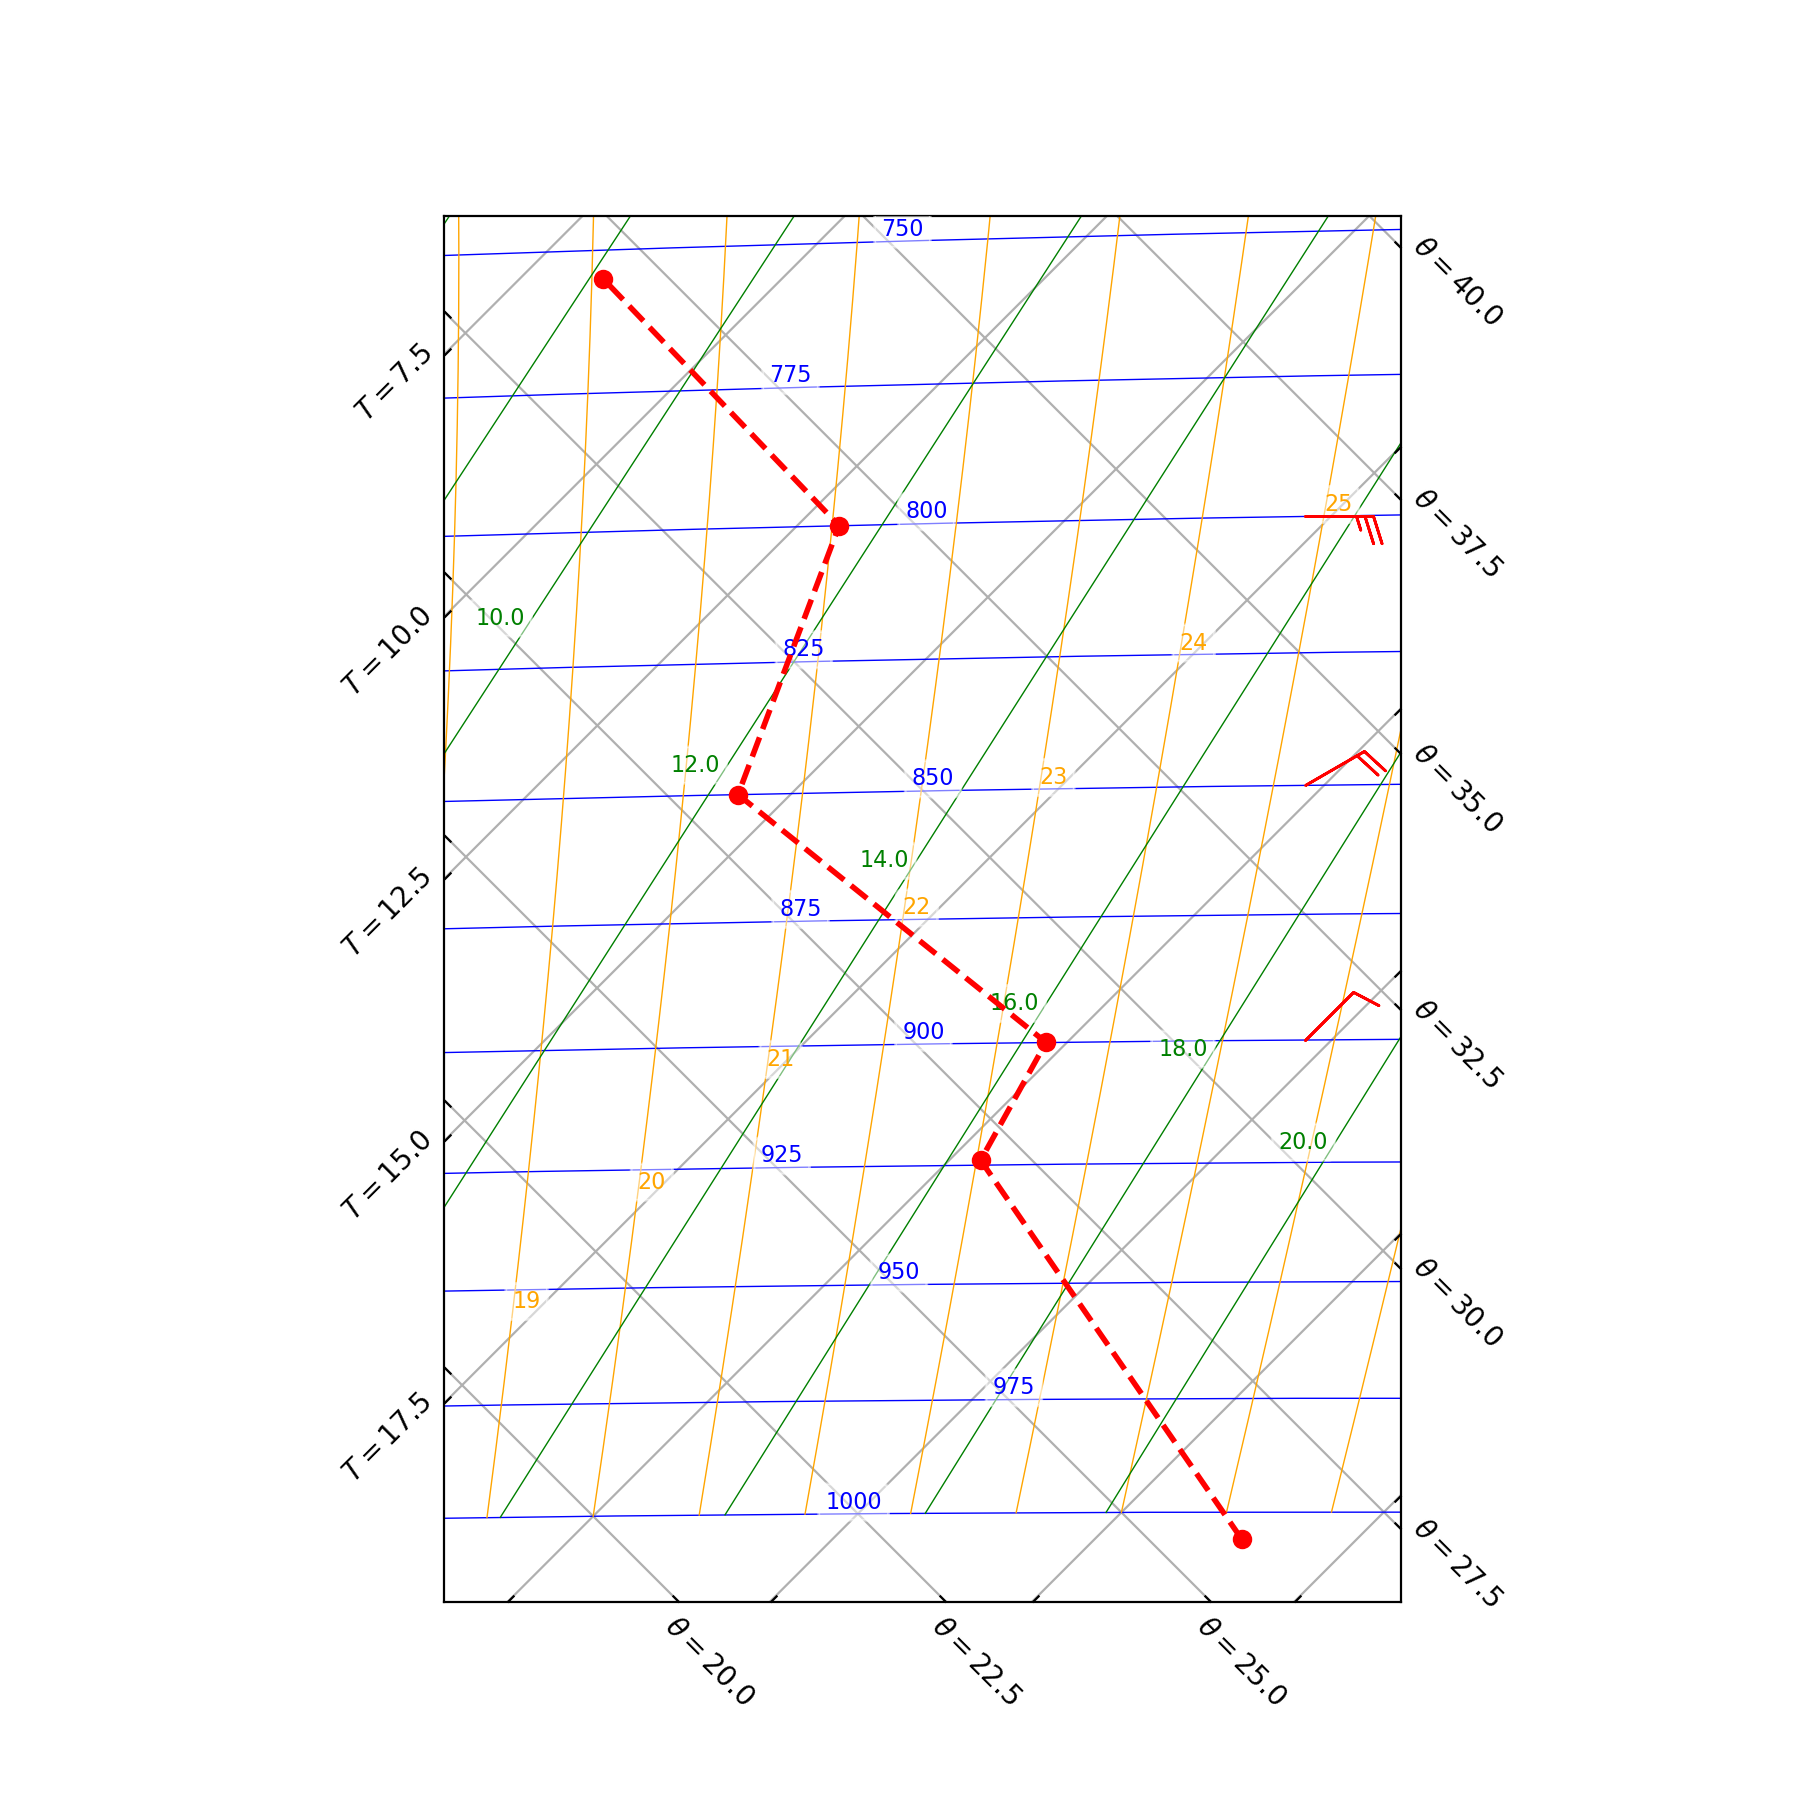
import matplotlib.pyplot as plt from tephi import Tephigram tpg = Tephigram() data = [[1006, 26.4], [924, 20.3], [900, 19.8], [850, 14.5], [800, 12.9], [755, 8.3]] profile = tpg.plot(data, color='red', linestyle='--', linewidth=2, marker='o') barbs = [(10, 45, 900), (20, 60, 850), (25, 90, 800)] profile.barbs(barbs) plt.show()(Source code, png, hires.png, pdf)

For associating wind barbs with an environmental lapse rate profile, see
barbs().