3. Tephigram customisation
This section discusses how finer control of the tephigram isobars, saturated adiabats and humidity mixing ratio lines and text can be achieved.
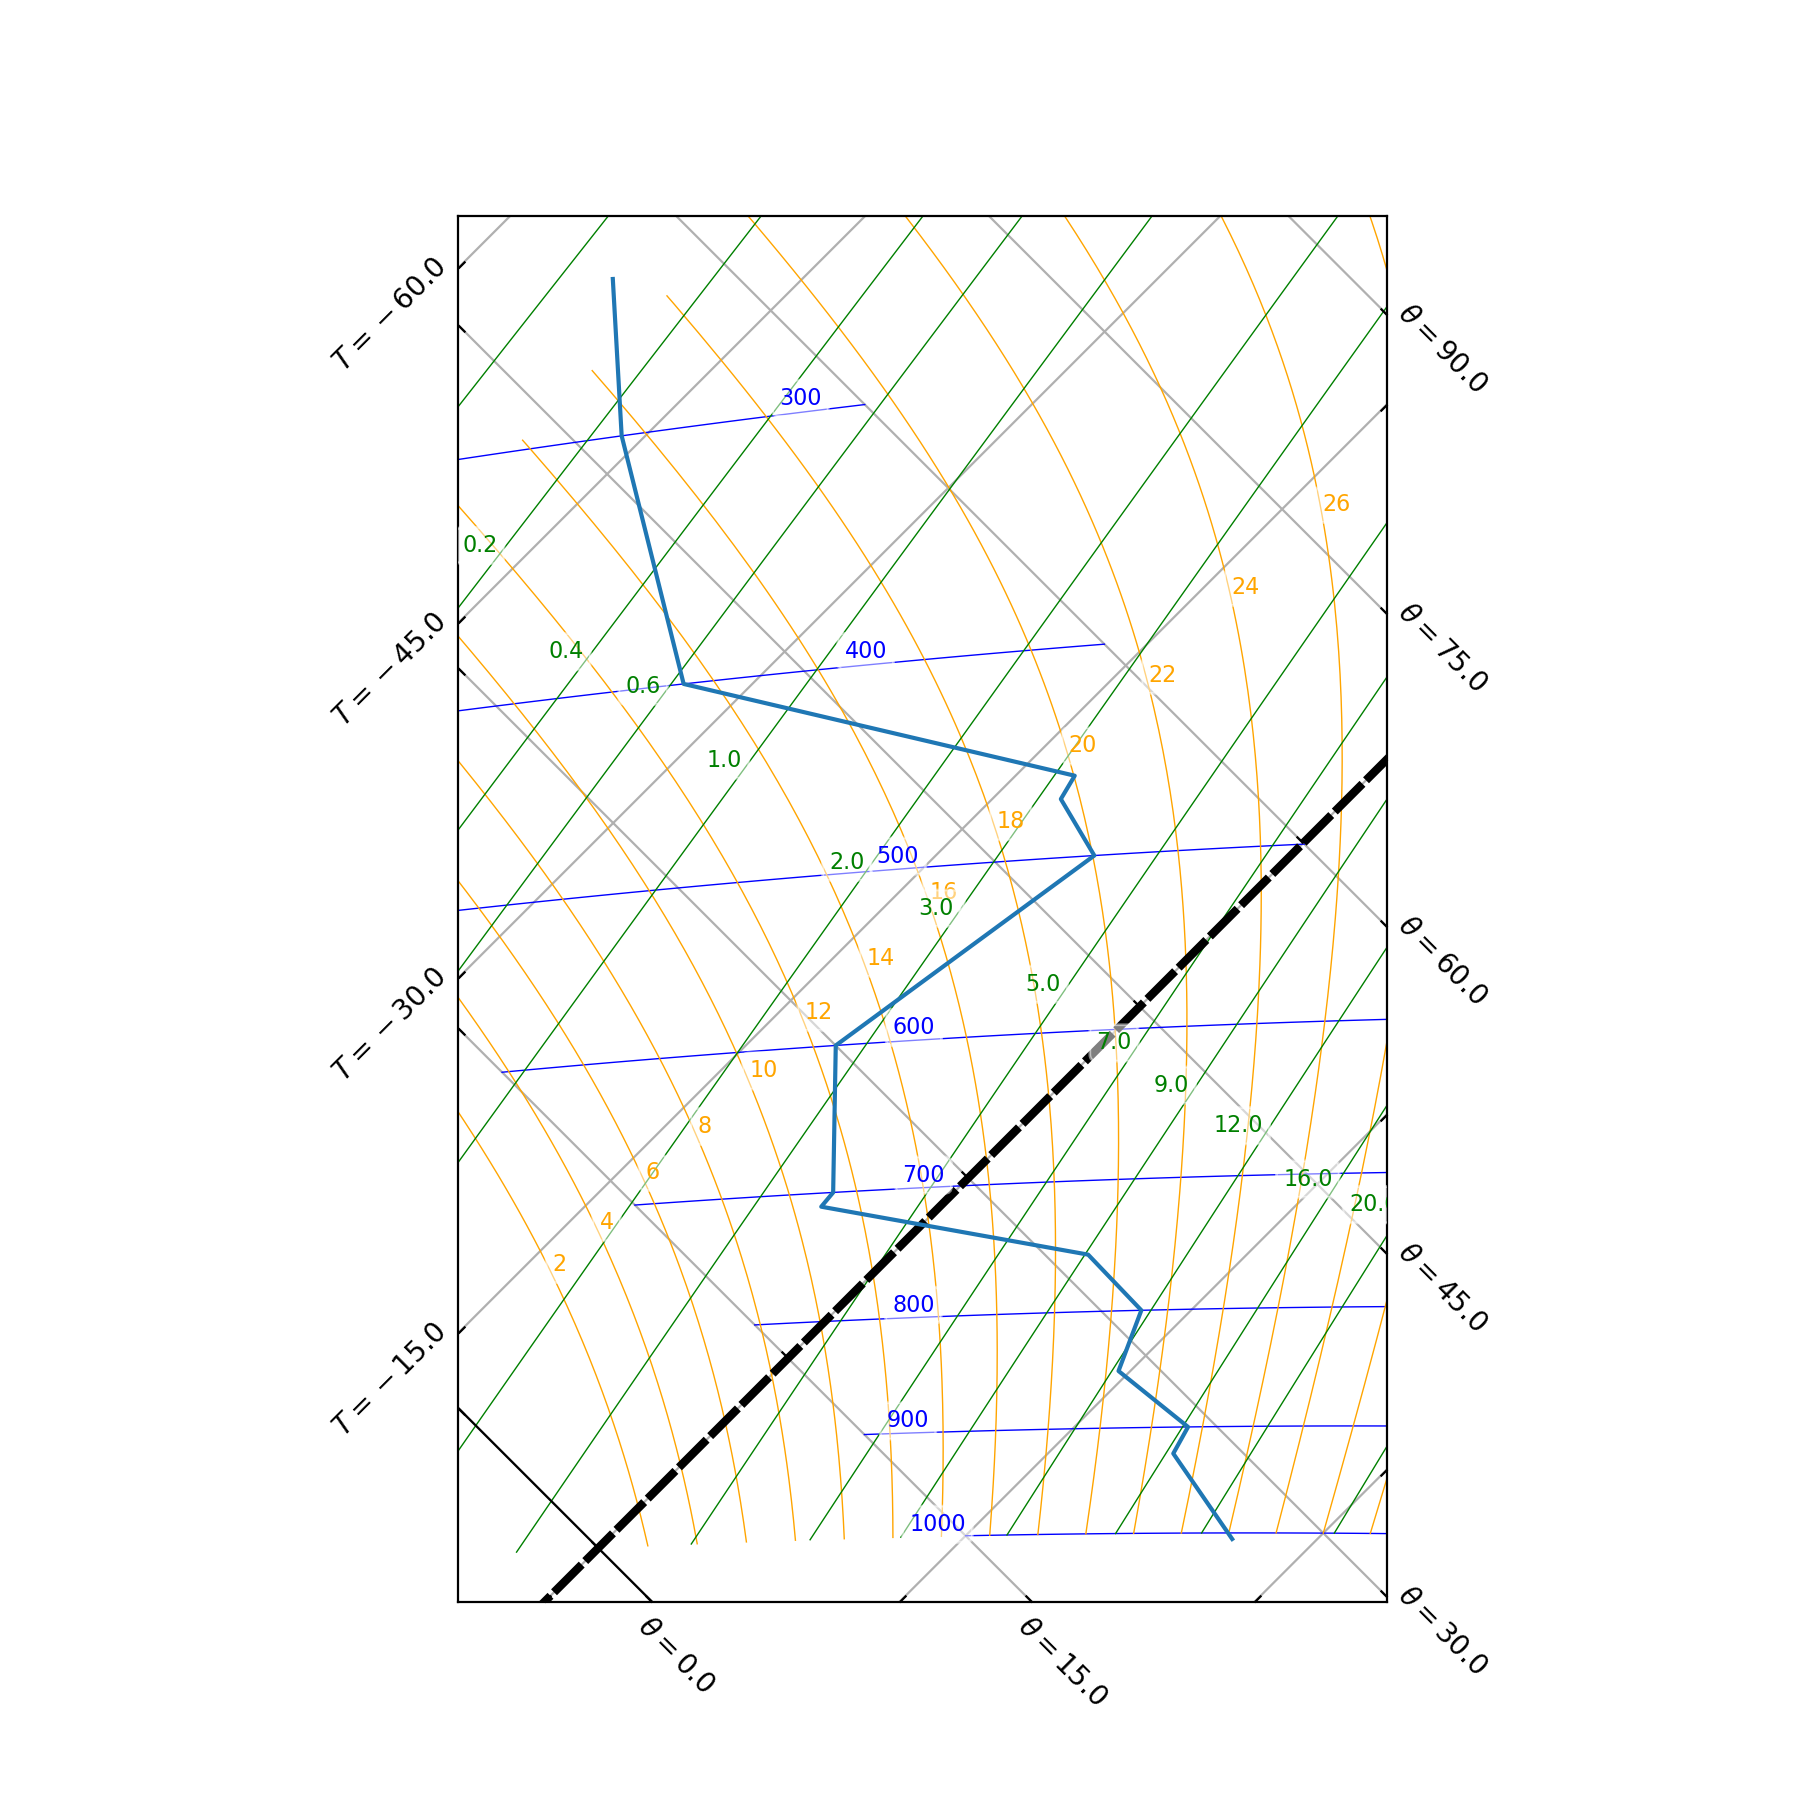
3.1. Isobar control
3.1.1. Isobar lines
The default behaviour of the tephigram isobar line is controlled by the tephi.ISOBAR_LINE dictionary:
>>> print tephi.ISOBAR_LINE
{'color': 'blue', 'linewidth': 0.5, 'clip_on': True}
This is a dictionary of key and value pairs that are passed through as keyword arguments to matplotlib.pyplot.plot().
Updating the ISOBAR_LINE dictionary will subsequently change the default behaviour of how the tephigram isobar lines are plotted.
import matplotlib.pyplot as plt
import os.path
import tephi
dew_point = os.path.join(tephi.DATA_DIR, 'dews.txt')
dew_data = tephi.loadtxt(dew_point, column_titles=('pressure', 'dewpoint'))
dews = zip(dew_data.pressure, dew_data.dewpoint)
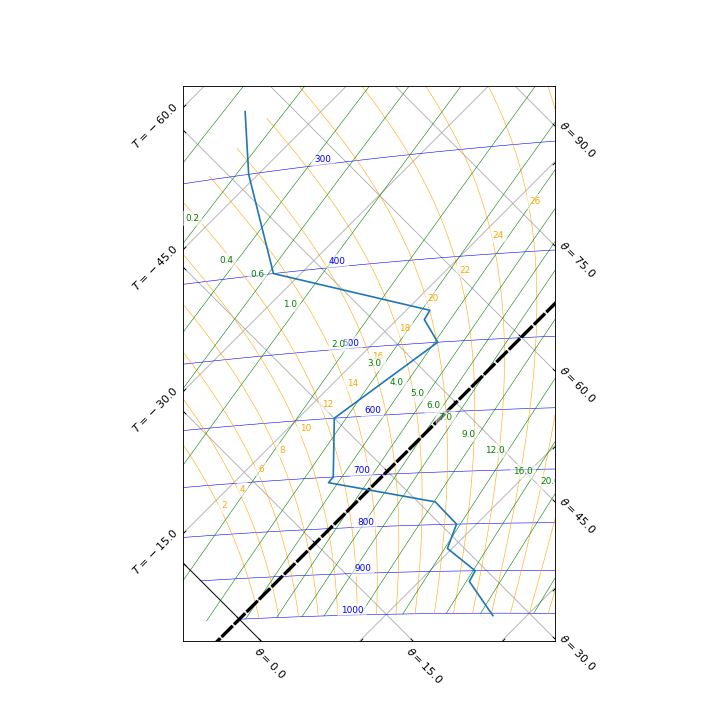
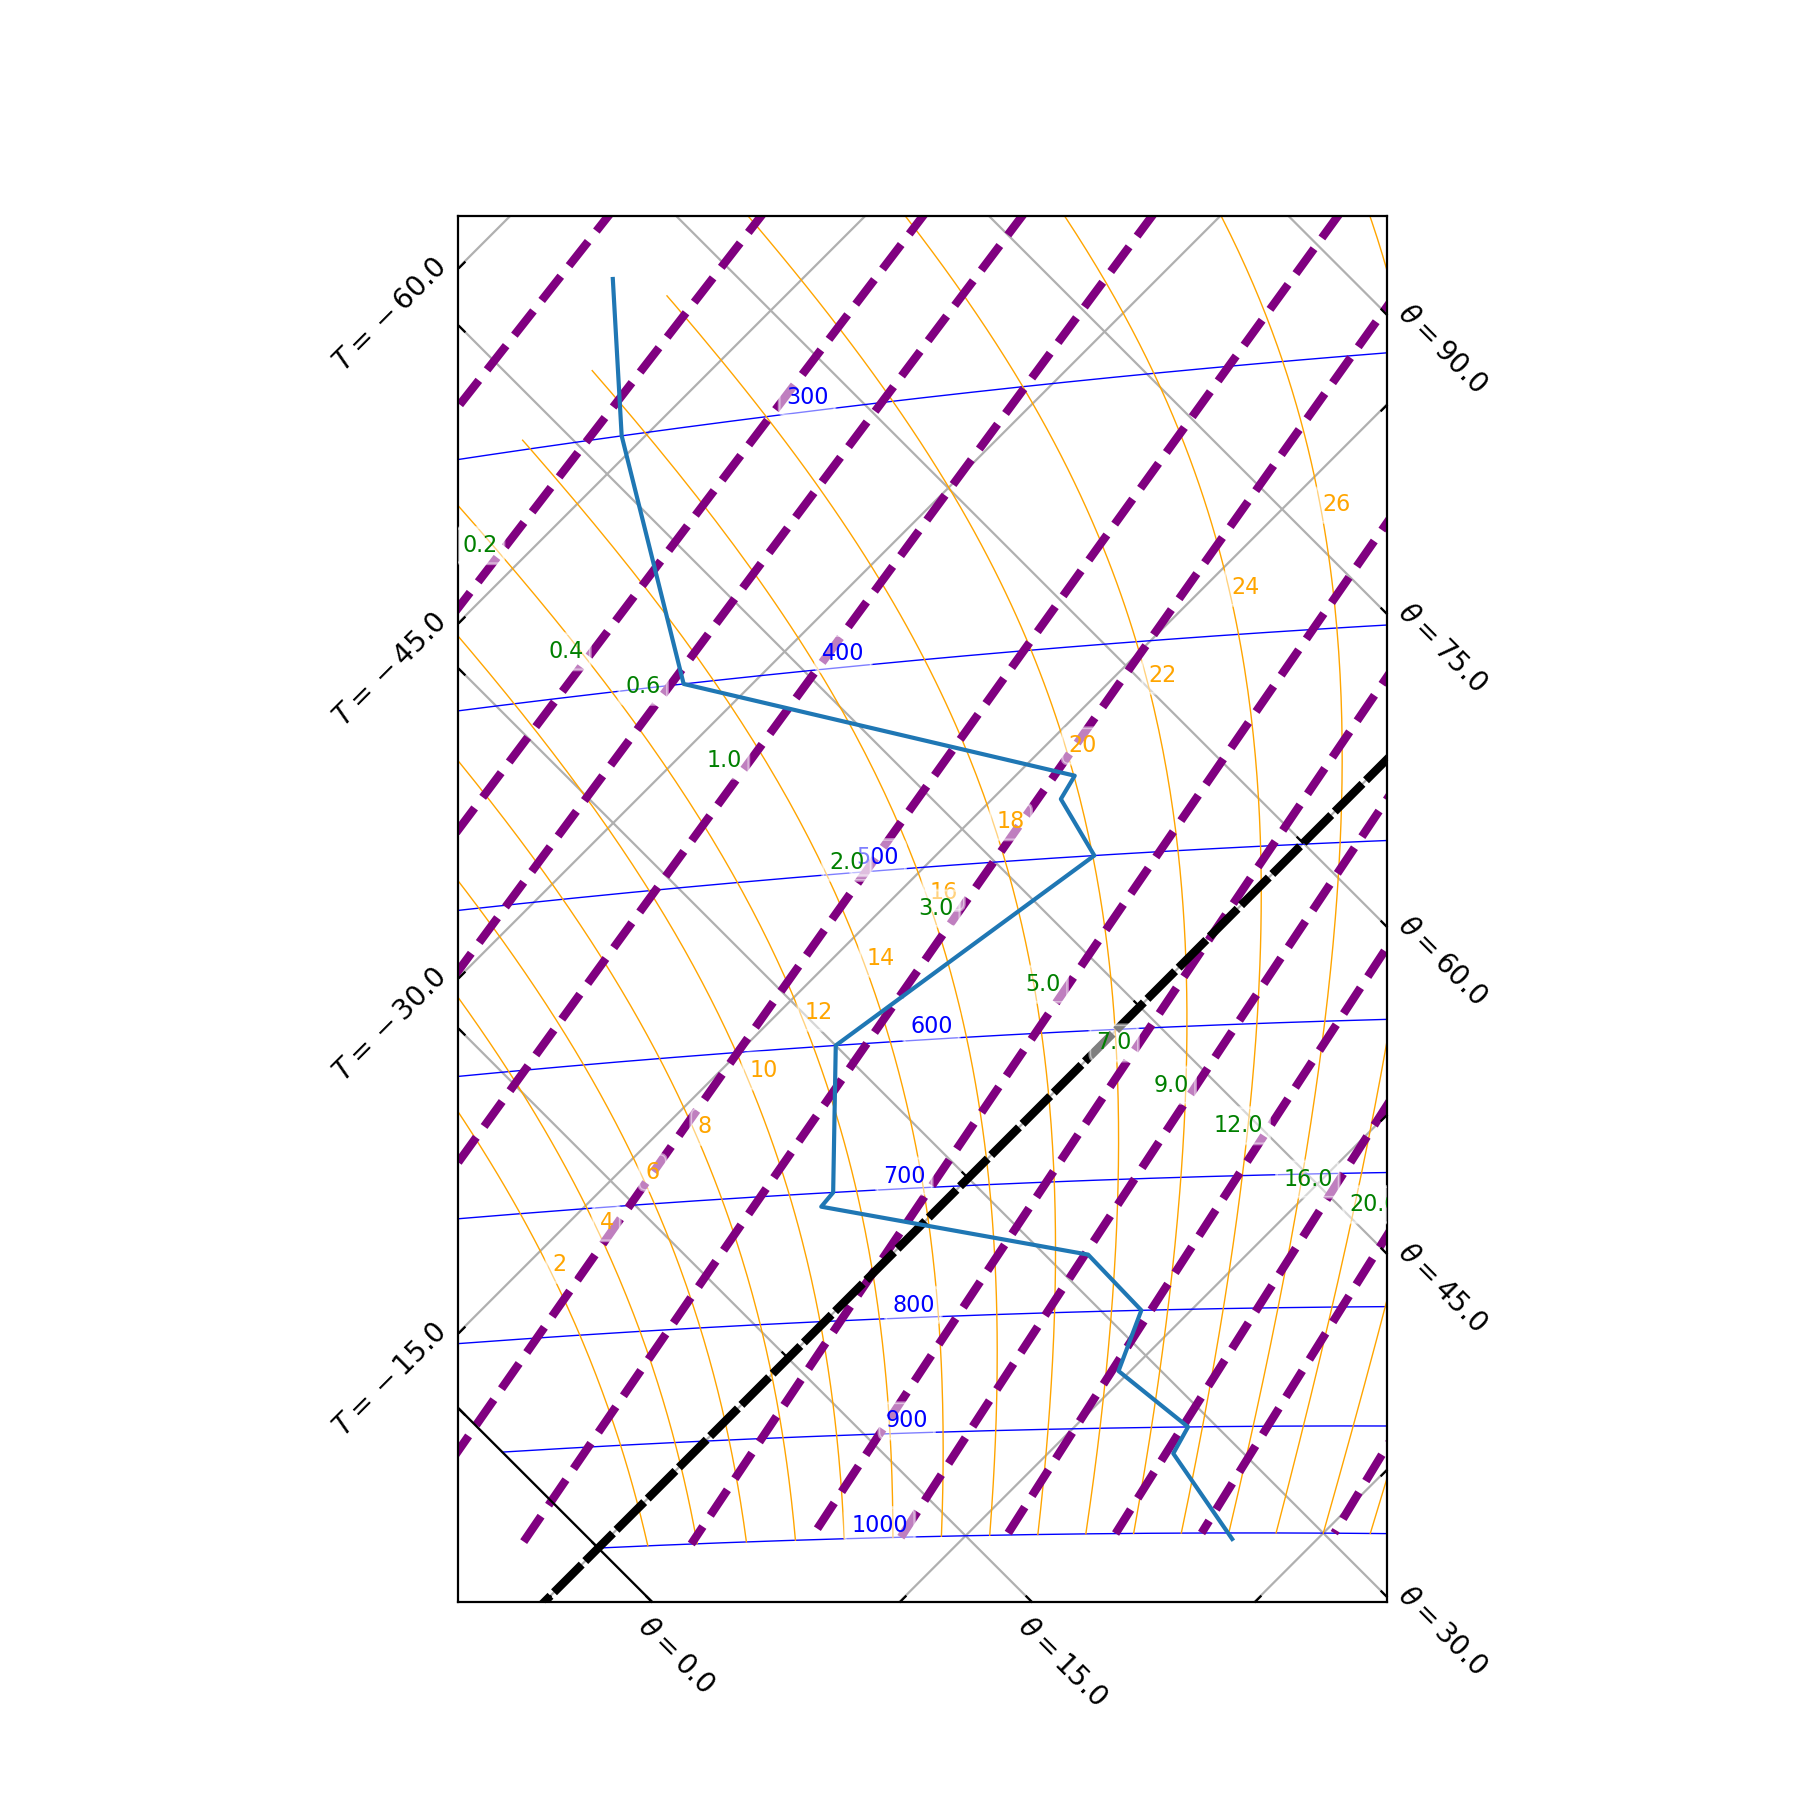
tephi.ISOBAR_LINE.update({'color': 'purple', 'linewidth': 3, 'linestyle': '--'})
tpg = tephi.Tephigram()
tpg.plot(dews)
plt.show()
(Source code, png, hires.png, pdf)

3.1.2. Isobar text
Similarly, the default behaviour of the tephigram isobar text is controlled by the tephi.ISOBAR_TEXT dictionary:
>>> print tephi.ISOBAR_TEXT
{'color': 'blue', 'va': 'bottom', 'ha': 'right', 'clip_on': True, 'size': 8}
This is a dictionary of key and value pairs that are passed through as keyword arguments to matplotlib.pyplot.text().
Updating the ISOBAR_TEXT dictionary will change the default behaviour of how the tephigram isobar text is plotted.
import matplotlib.pyplot as plt
import os.path
import tephi
dew_point = os.path.join(tephi.DATA_DIR, 'dews.txt')
dew_data = tephi.loadtxt(dew_point, column_titles=('pressure', 'dewpoint'))
dews = zip(dew_data.pressure, dew_data.dewpoint)
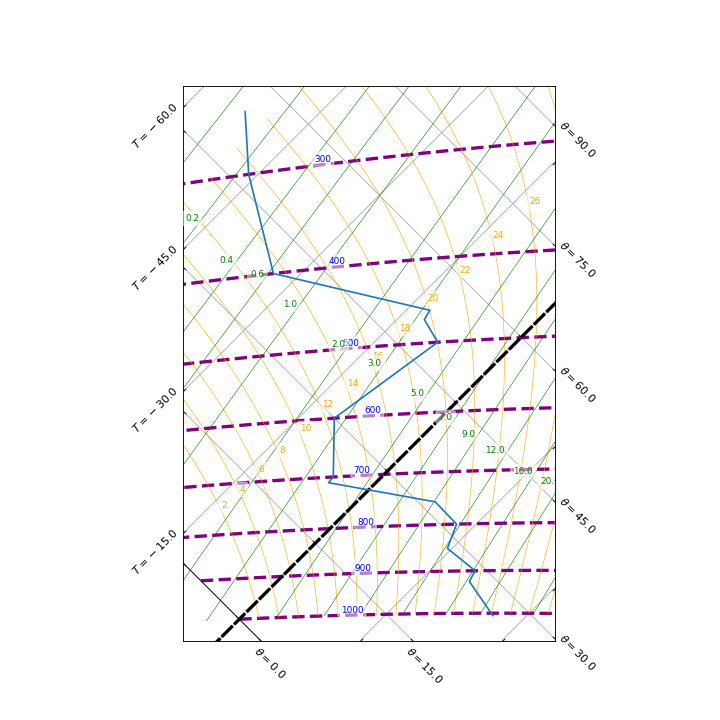
tephi.ISOBAR_TEXT.update({'color': 'purple', 'size': 12})
tpg = tephi.Tephigram()
tpg.plot(dews)
plt.show()
(Source code, png, hires.png, pdf)

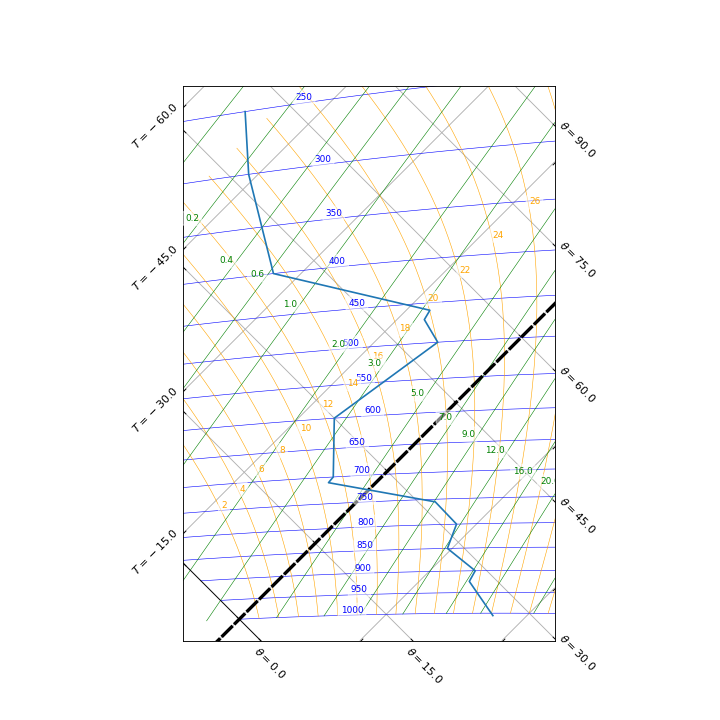
3.1.3. Isobar frequency
The frequency at which isobar lines are plotted on the tephigram is controlled by the tephi.ISOBAR_SPEC list:
>>> print tephi.ISOBAR_SPEC
[(25, 0.03), (50, 0.1), (100, 0.25), (200, 1.5)]
This line specification is a sequence of one or more tuple pairs that contain an isobar pressure line step and a zoom level.
For example, (25, 0.03) states that all isobar lines that are a multiple of 25 mb will be plotted i.e. visible, when the zoom level is at or
below 0.03.
The overall range of isobar pressure levels that may be plotted is controlled by the tephi.MIN_PRESSURE and
tephi.MAX_PRESSURE variables:
>>> print tephi.MIN_PRESSURE
50
>>> print tephi.MAX_PRESSURE
1000
Note that, it is possible to set a fixed isobar pressure line step for a tephigram plot by setting the associated zoom level to None.
This is opposed to relying on the plot zoom level of the tephigram to control line visibility.
For example, to always show isobar lines that are a multiple of 50 mb, irrespective of the zoom level,
import matplotlib.pyplot as plt
import os.path
import tephi
dew_point = os.path.join(tephi.DATA_DIR, 'dews.txt')
dew_data = tephi.loadtxt(dew_point, column_titles=('pressure', 'dewpoint'))
dews = zip(dew_data.pressure, dew_data.dewpoint)
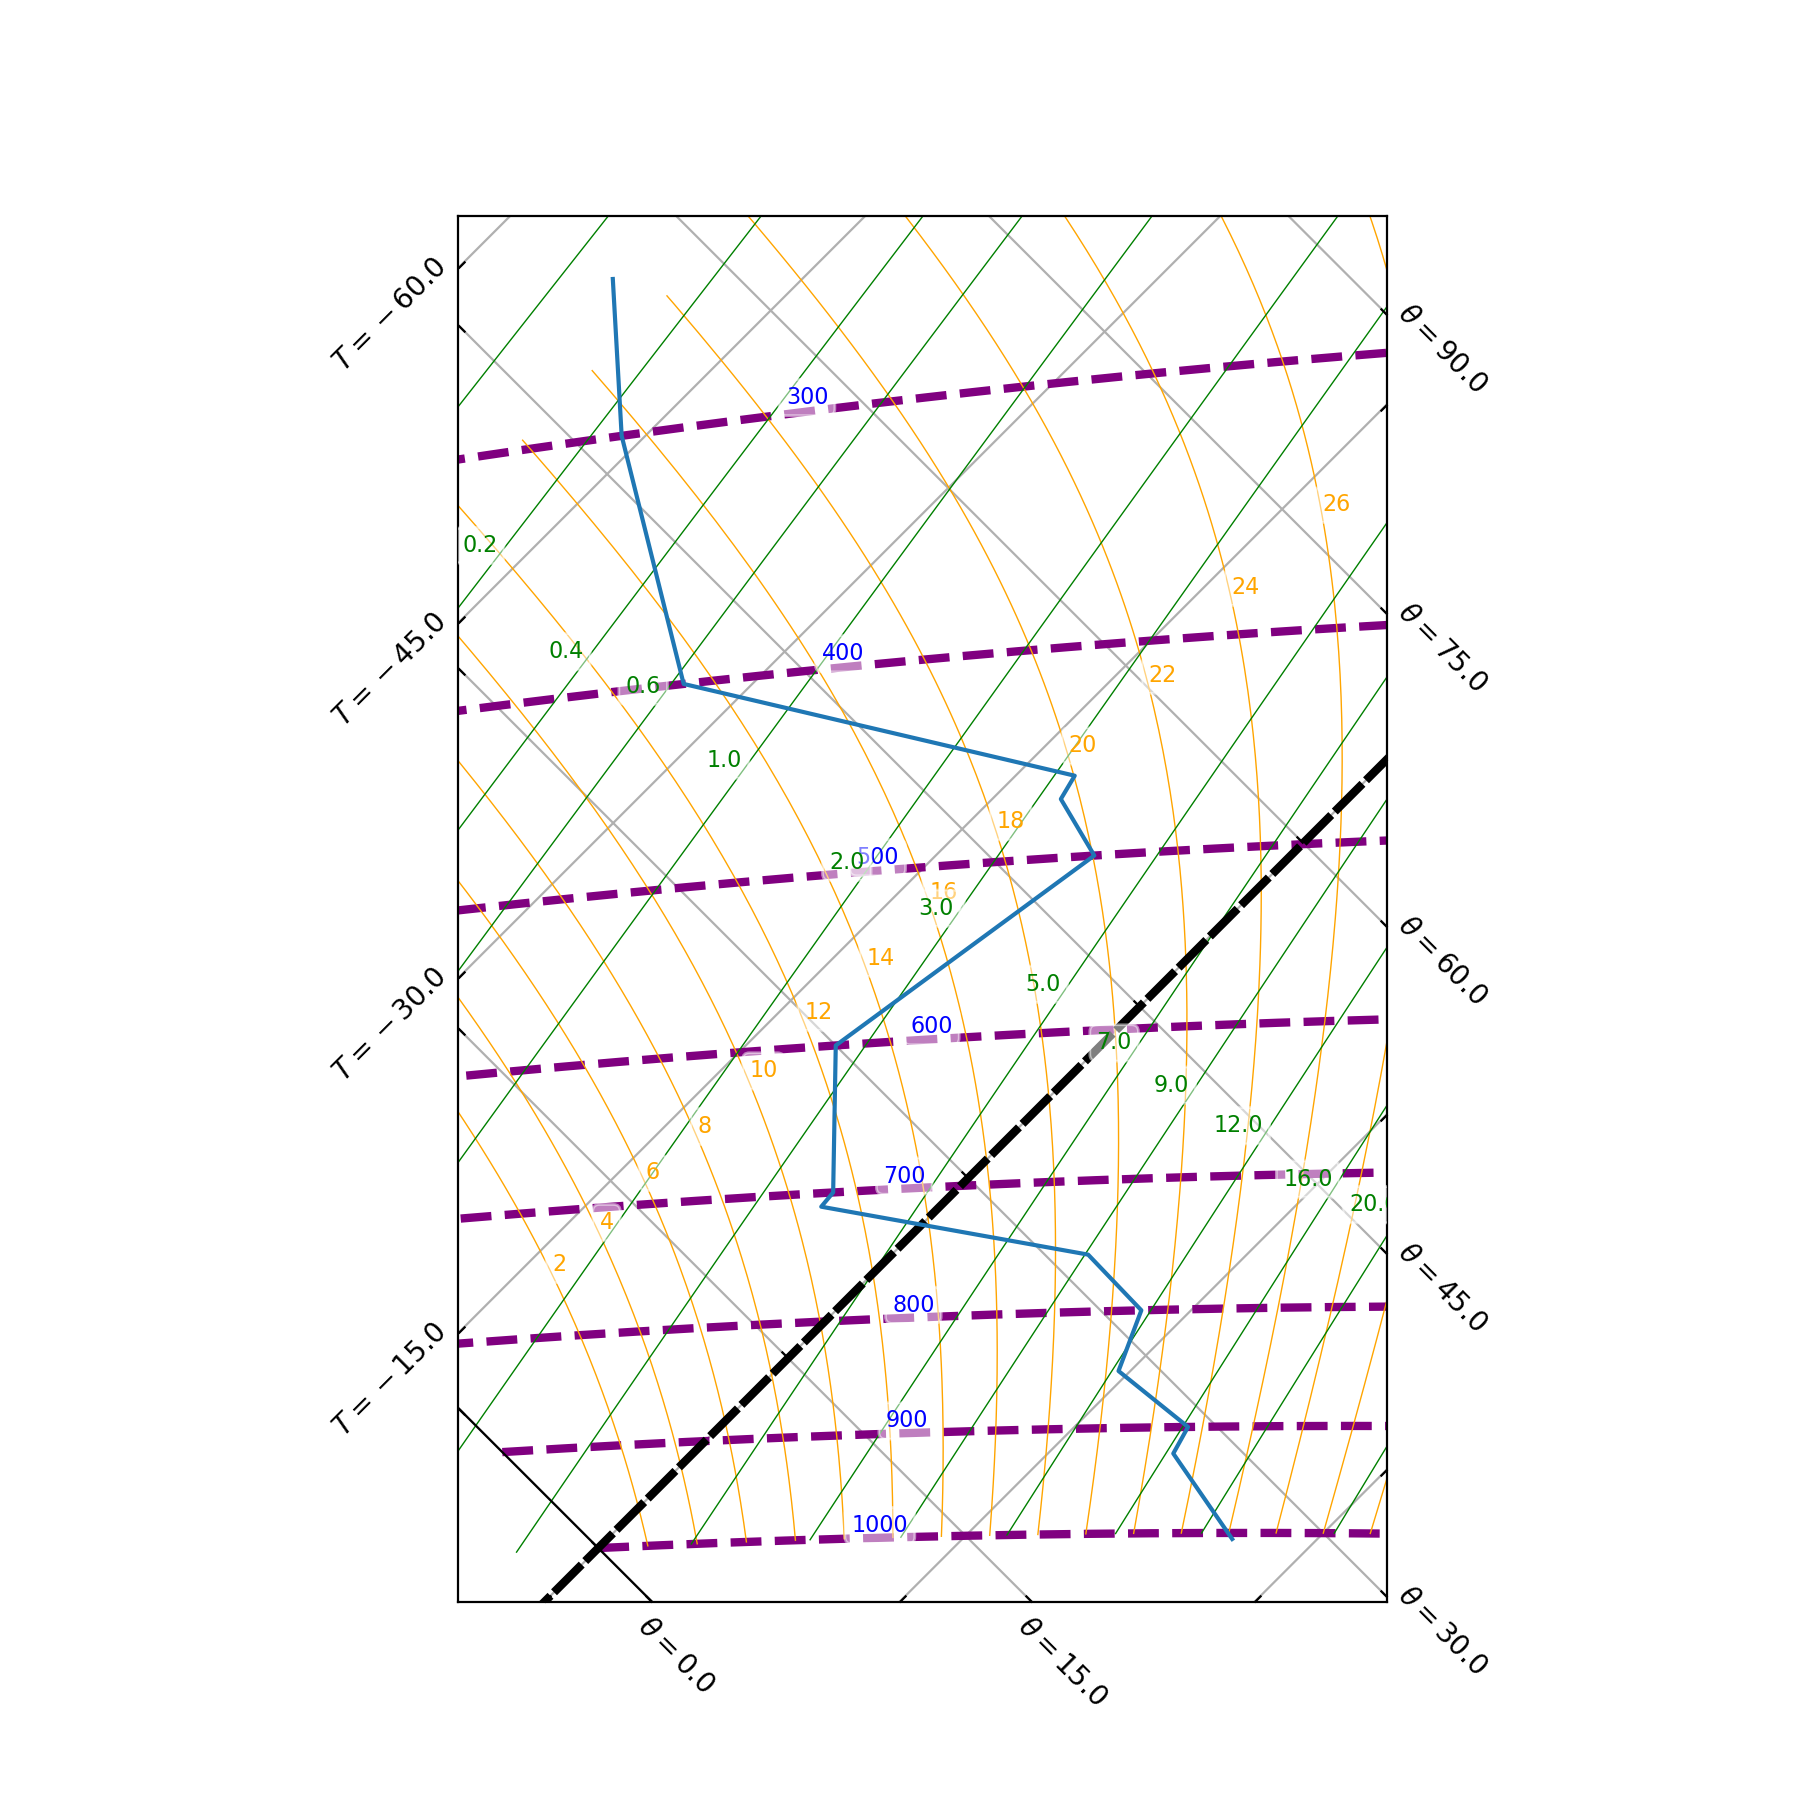
tephi.ISOBAR_SPEC = [(50, None)]
tpg = tephi.Tephigram()
tpg.plot(dews)
plt.show()
(Source code, png, hires.png, pdf)
It is also possible to control which individual isobar lines should be fixed via the tephi.ISOBAR_FIXED list:
>>> print tephi.ISOBAR_FIXED
[50, 1000]
By default, the isobar lines at 50 mb and 1000 mb will always be plotted.
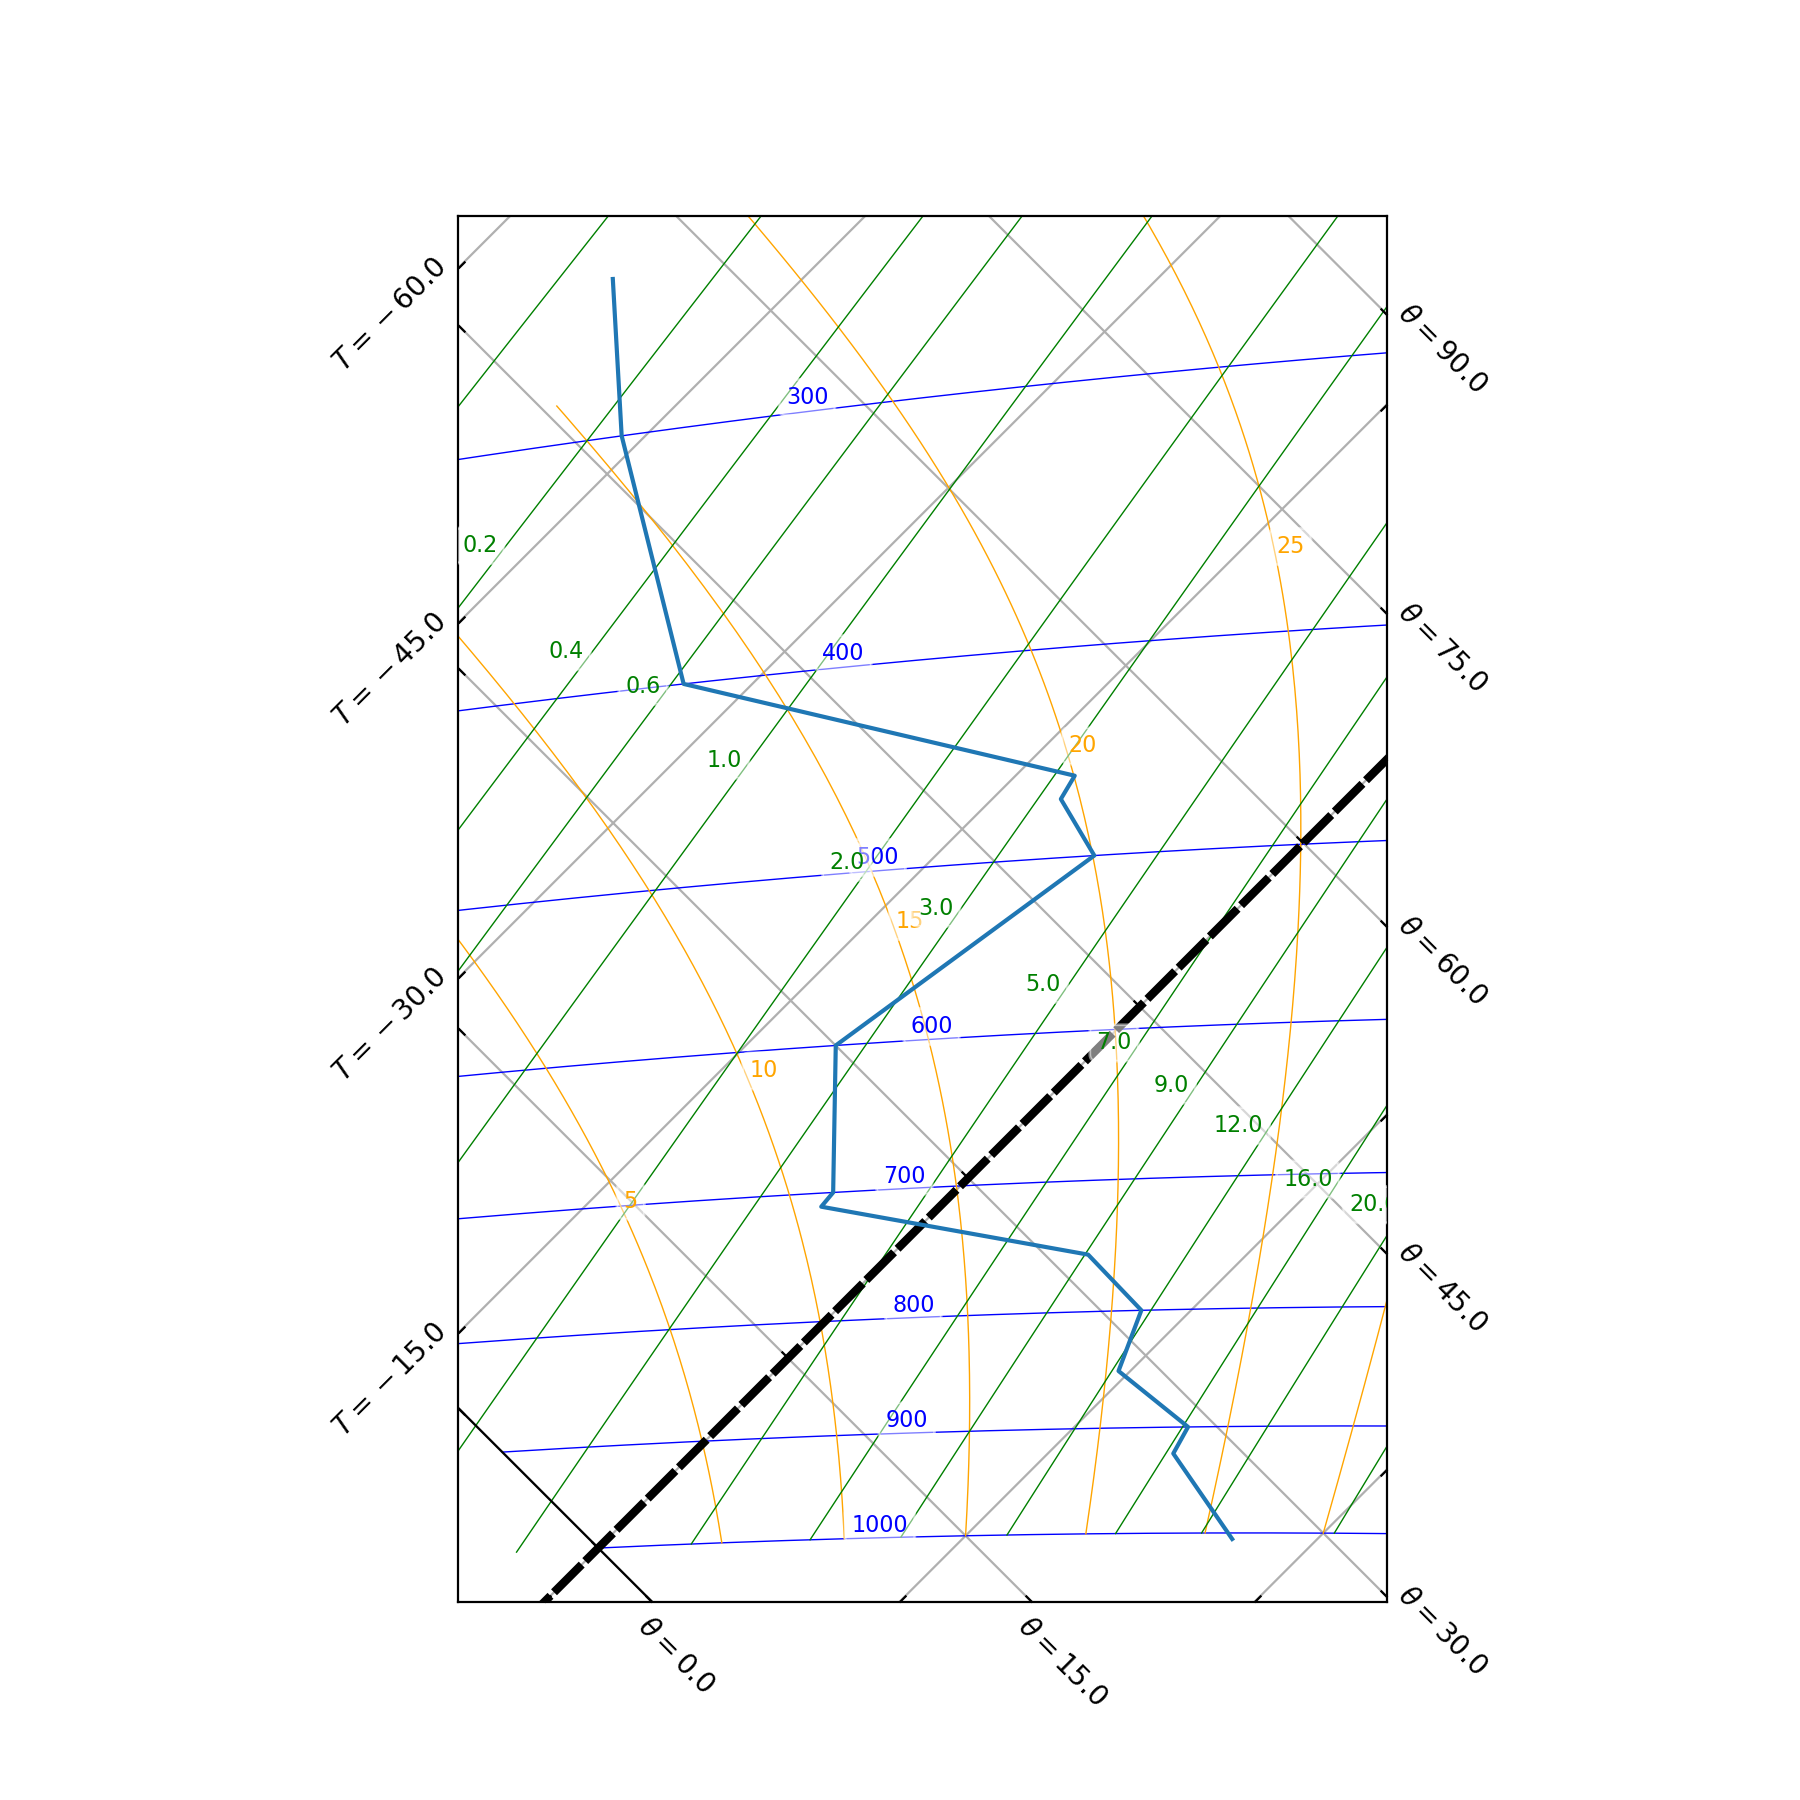
3.1.4. Isobar line extent
The extent of each tephigram isobar line is controlled by the tephi.MIN_THETA and
tephi.MAX_THETA variables:
>>> print tephi.MIN_THETA
0
>>> print tephi.MAX_THETA
250
For example, to change the isobar line extent behaviour to be between 15 oC and 60 oC,
import matplotlib.pyplot as plt
import os.path
import tephi
dew_point = os.path.join(tephi.DATA_DIR, 'dews.txt')
dew_data = tephi.loadtxt(dew_point, column_titles=('pressure', 'dewpoint'))
dews = zip(dew_data.pressure, dew_data.dewpoint)
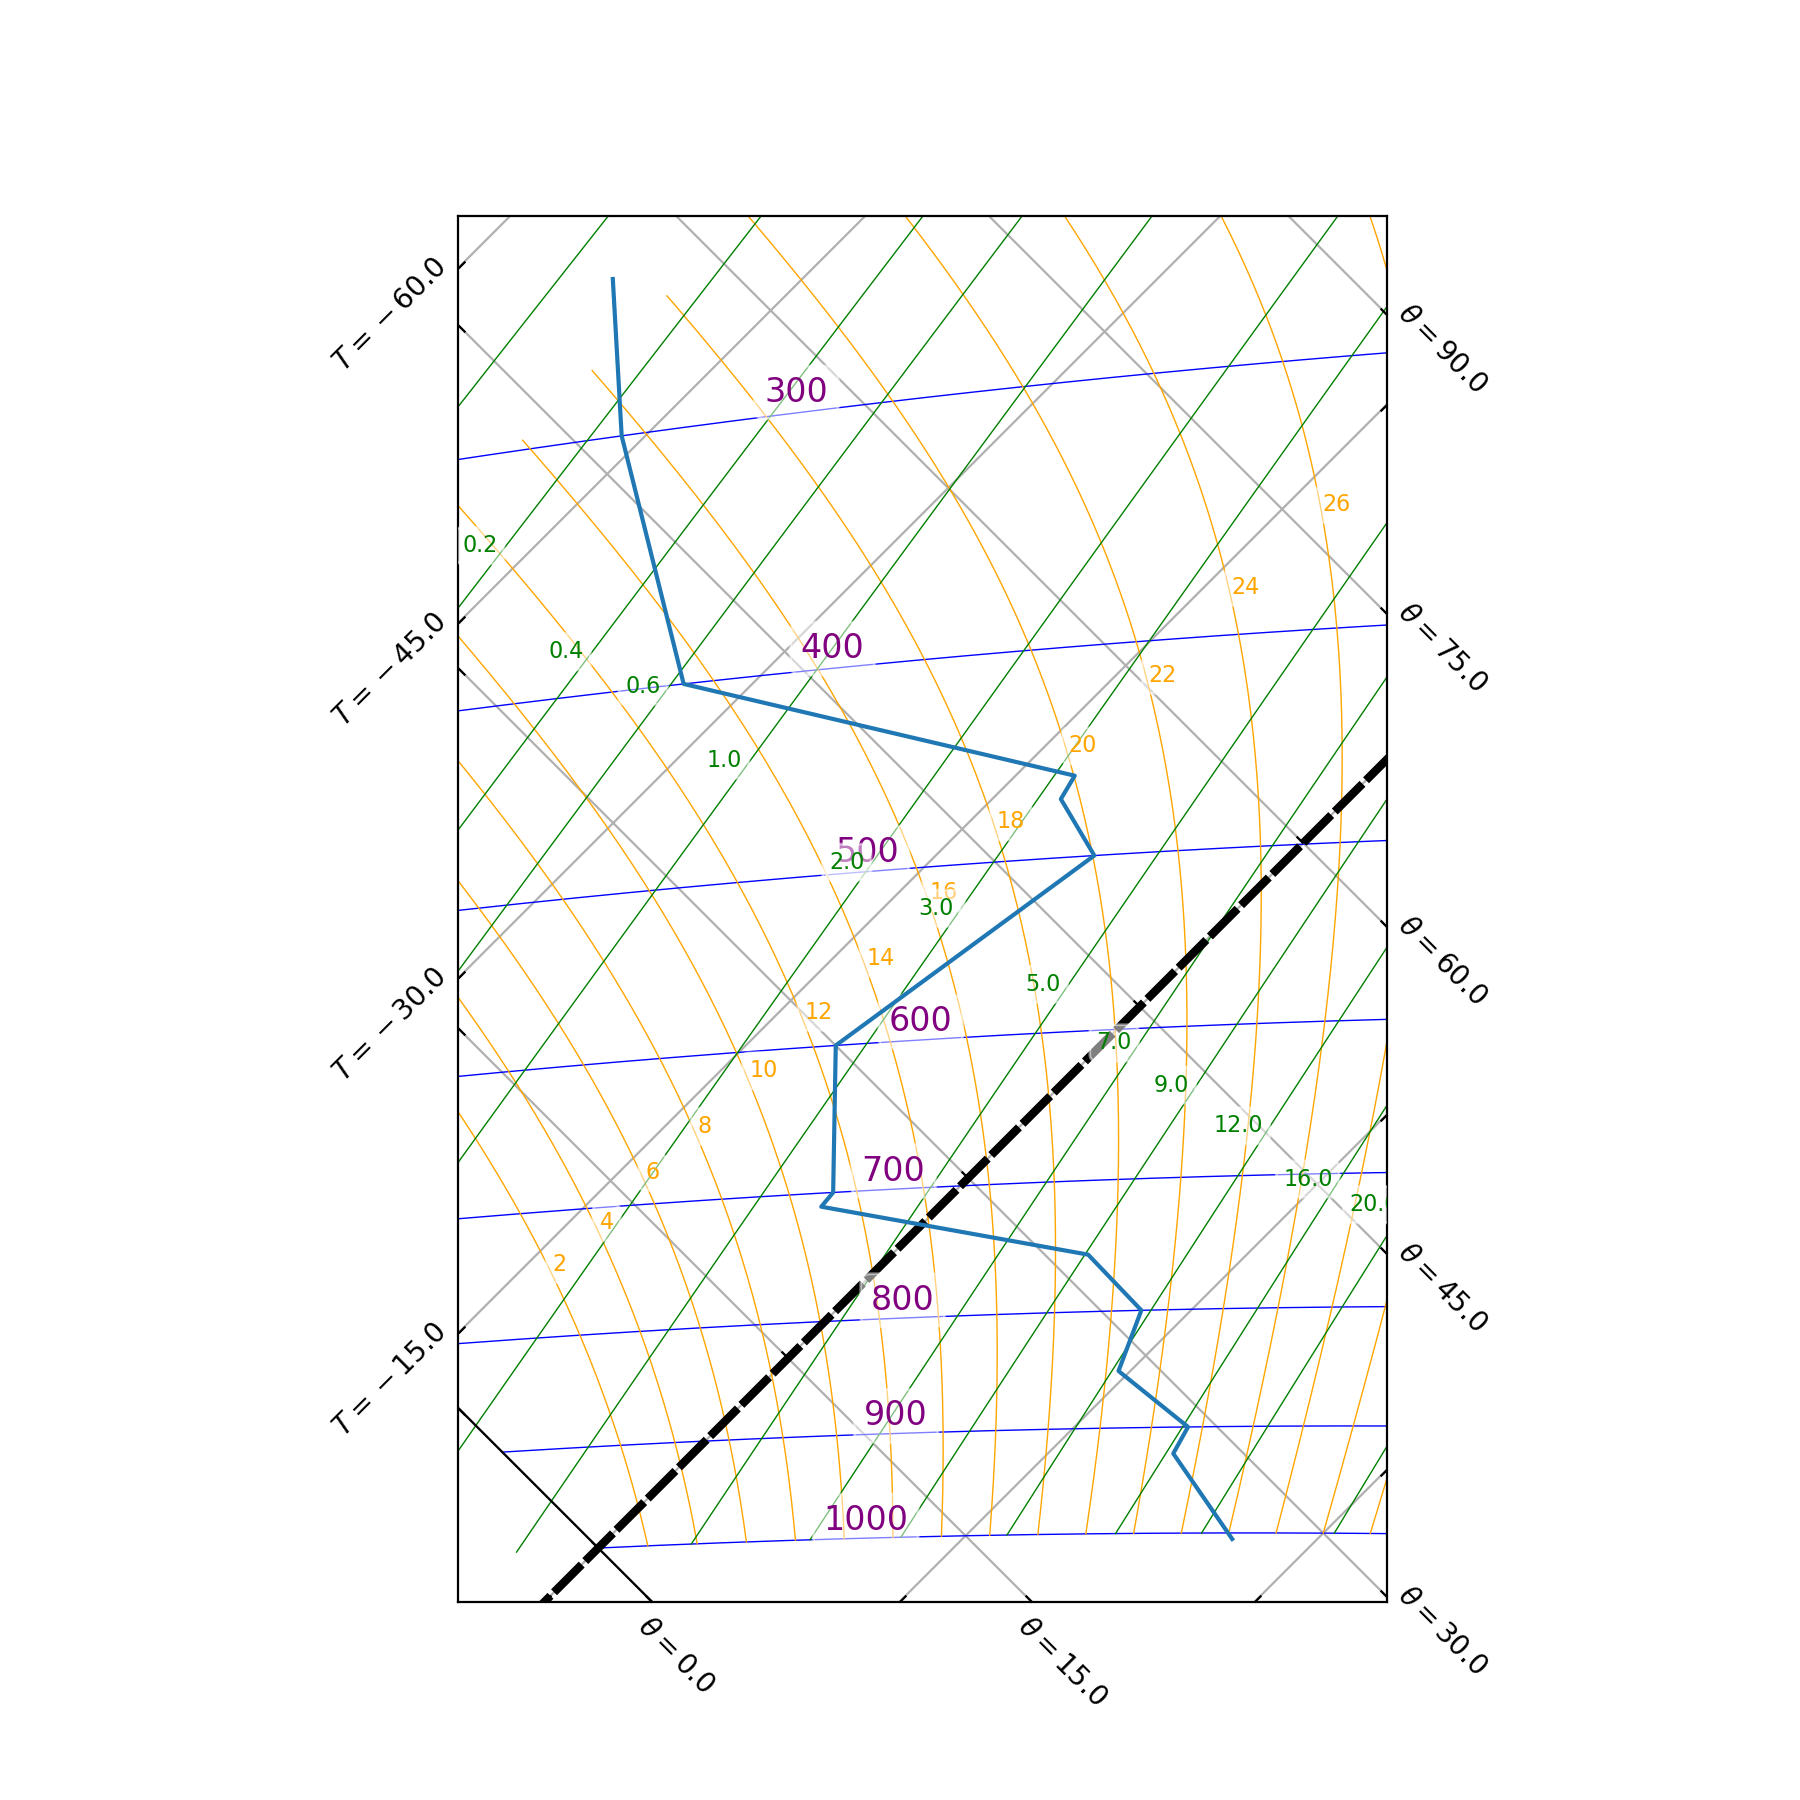
tephi.MIN_THETA = 15
tephi.MAX_THETA = 60
tpg = tephi.Tephigram()
tpg.plot(dews)
plt.show()
(Source code, png, hires.png, pdf)

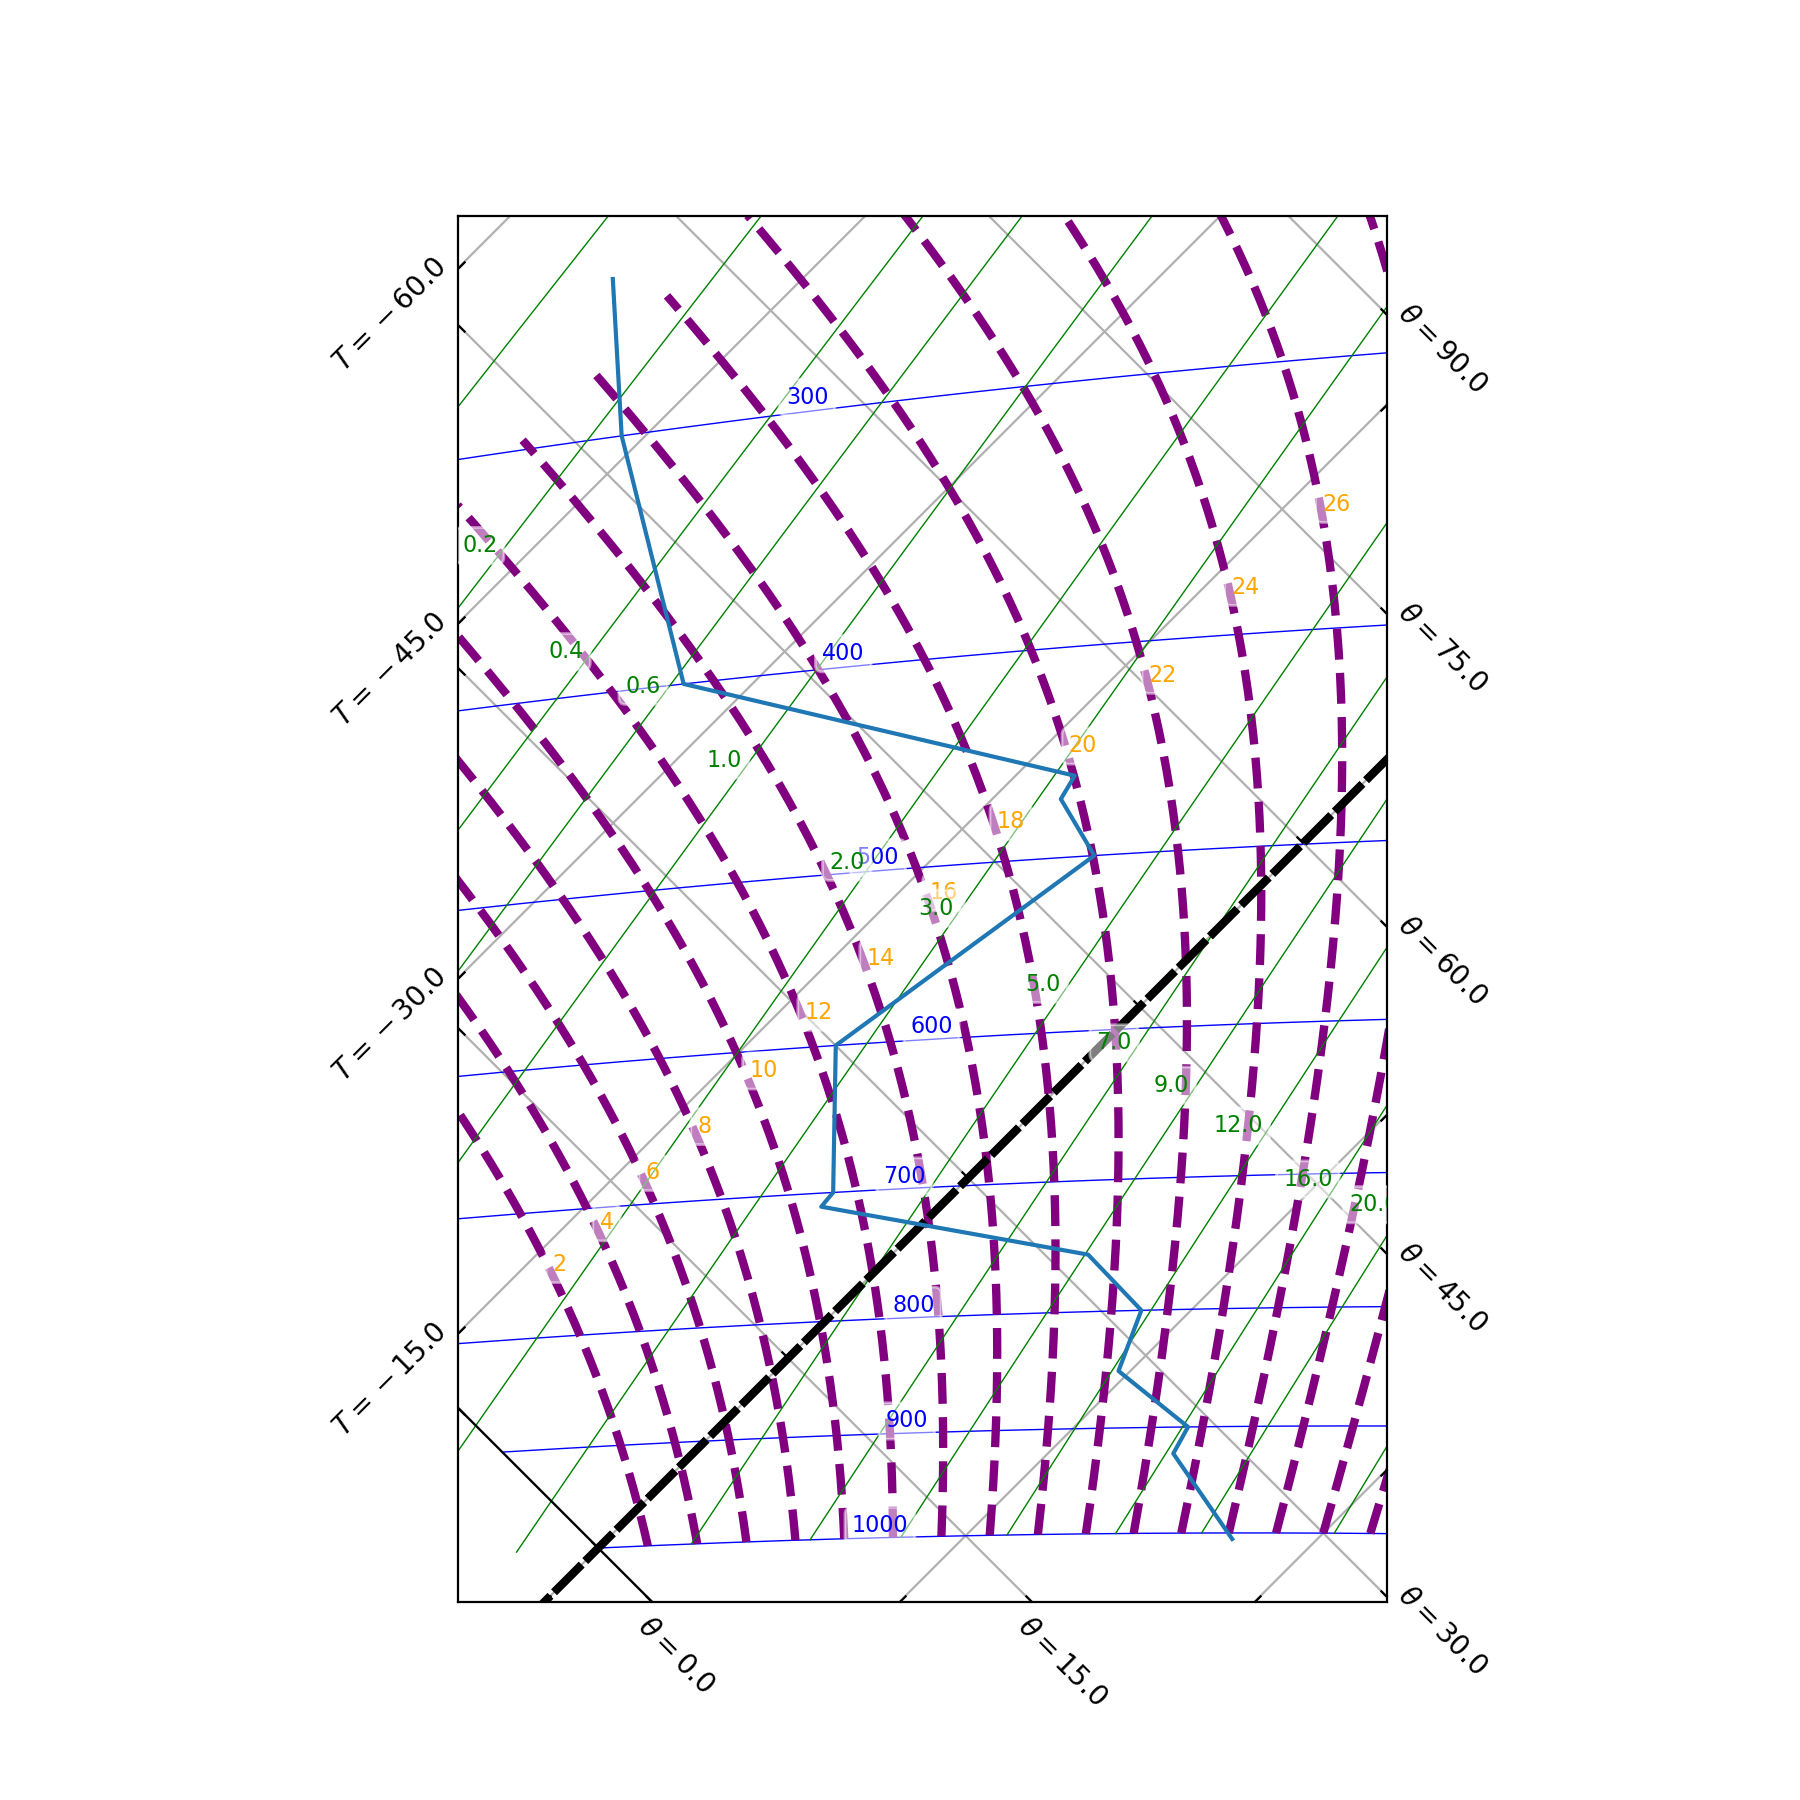
3.2. Saturated adiabat control
3.2.1. Saturated adiabat lines
The default behaviour of the tephigram pseudo saturated wet adiabat line is controlled by the tephi.WET_ADIABAT_LINE dictionary:
>>> print .WET_ADIABAT_LINE
{'color': 'orange', 'linewidth': 0.5, 'clip_on': True}
This is a dictionary of key and value pairs that are passed through as keyword arguments to matplotlib.pyplot.plot().
Updating the WET_ADIABAT_LINE dictionary will change the default behaviour of all saturated adiabat line plotting.
import matplotlib.pyplot as plt
import os.path

import tephi

dew_point = os.path.join(tephi.DATA_DIR, 'dews.txt')
dew_data = tephi.loadtxt(dew_point, column_titles=('pressure', 'dewpoint'))
dews = zip(dew_data.pressure, dew_data.dewpoint)
tephi.WET_ADIABAT_LINE.update({'color': 'purple', 'linewidth': 3, 'linestyle': '--'})
tpg = tephi.Tephigram()
tpg.plot(dews)
plt.show()
(Source code, png, hires.png, pdf)

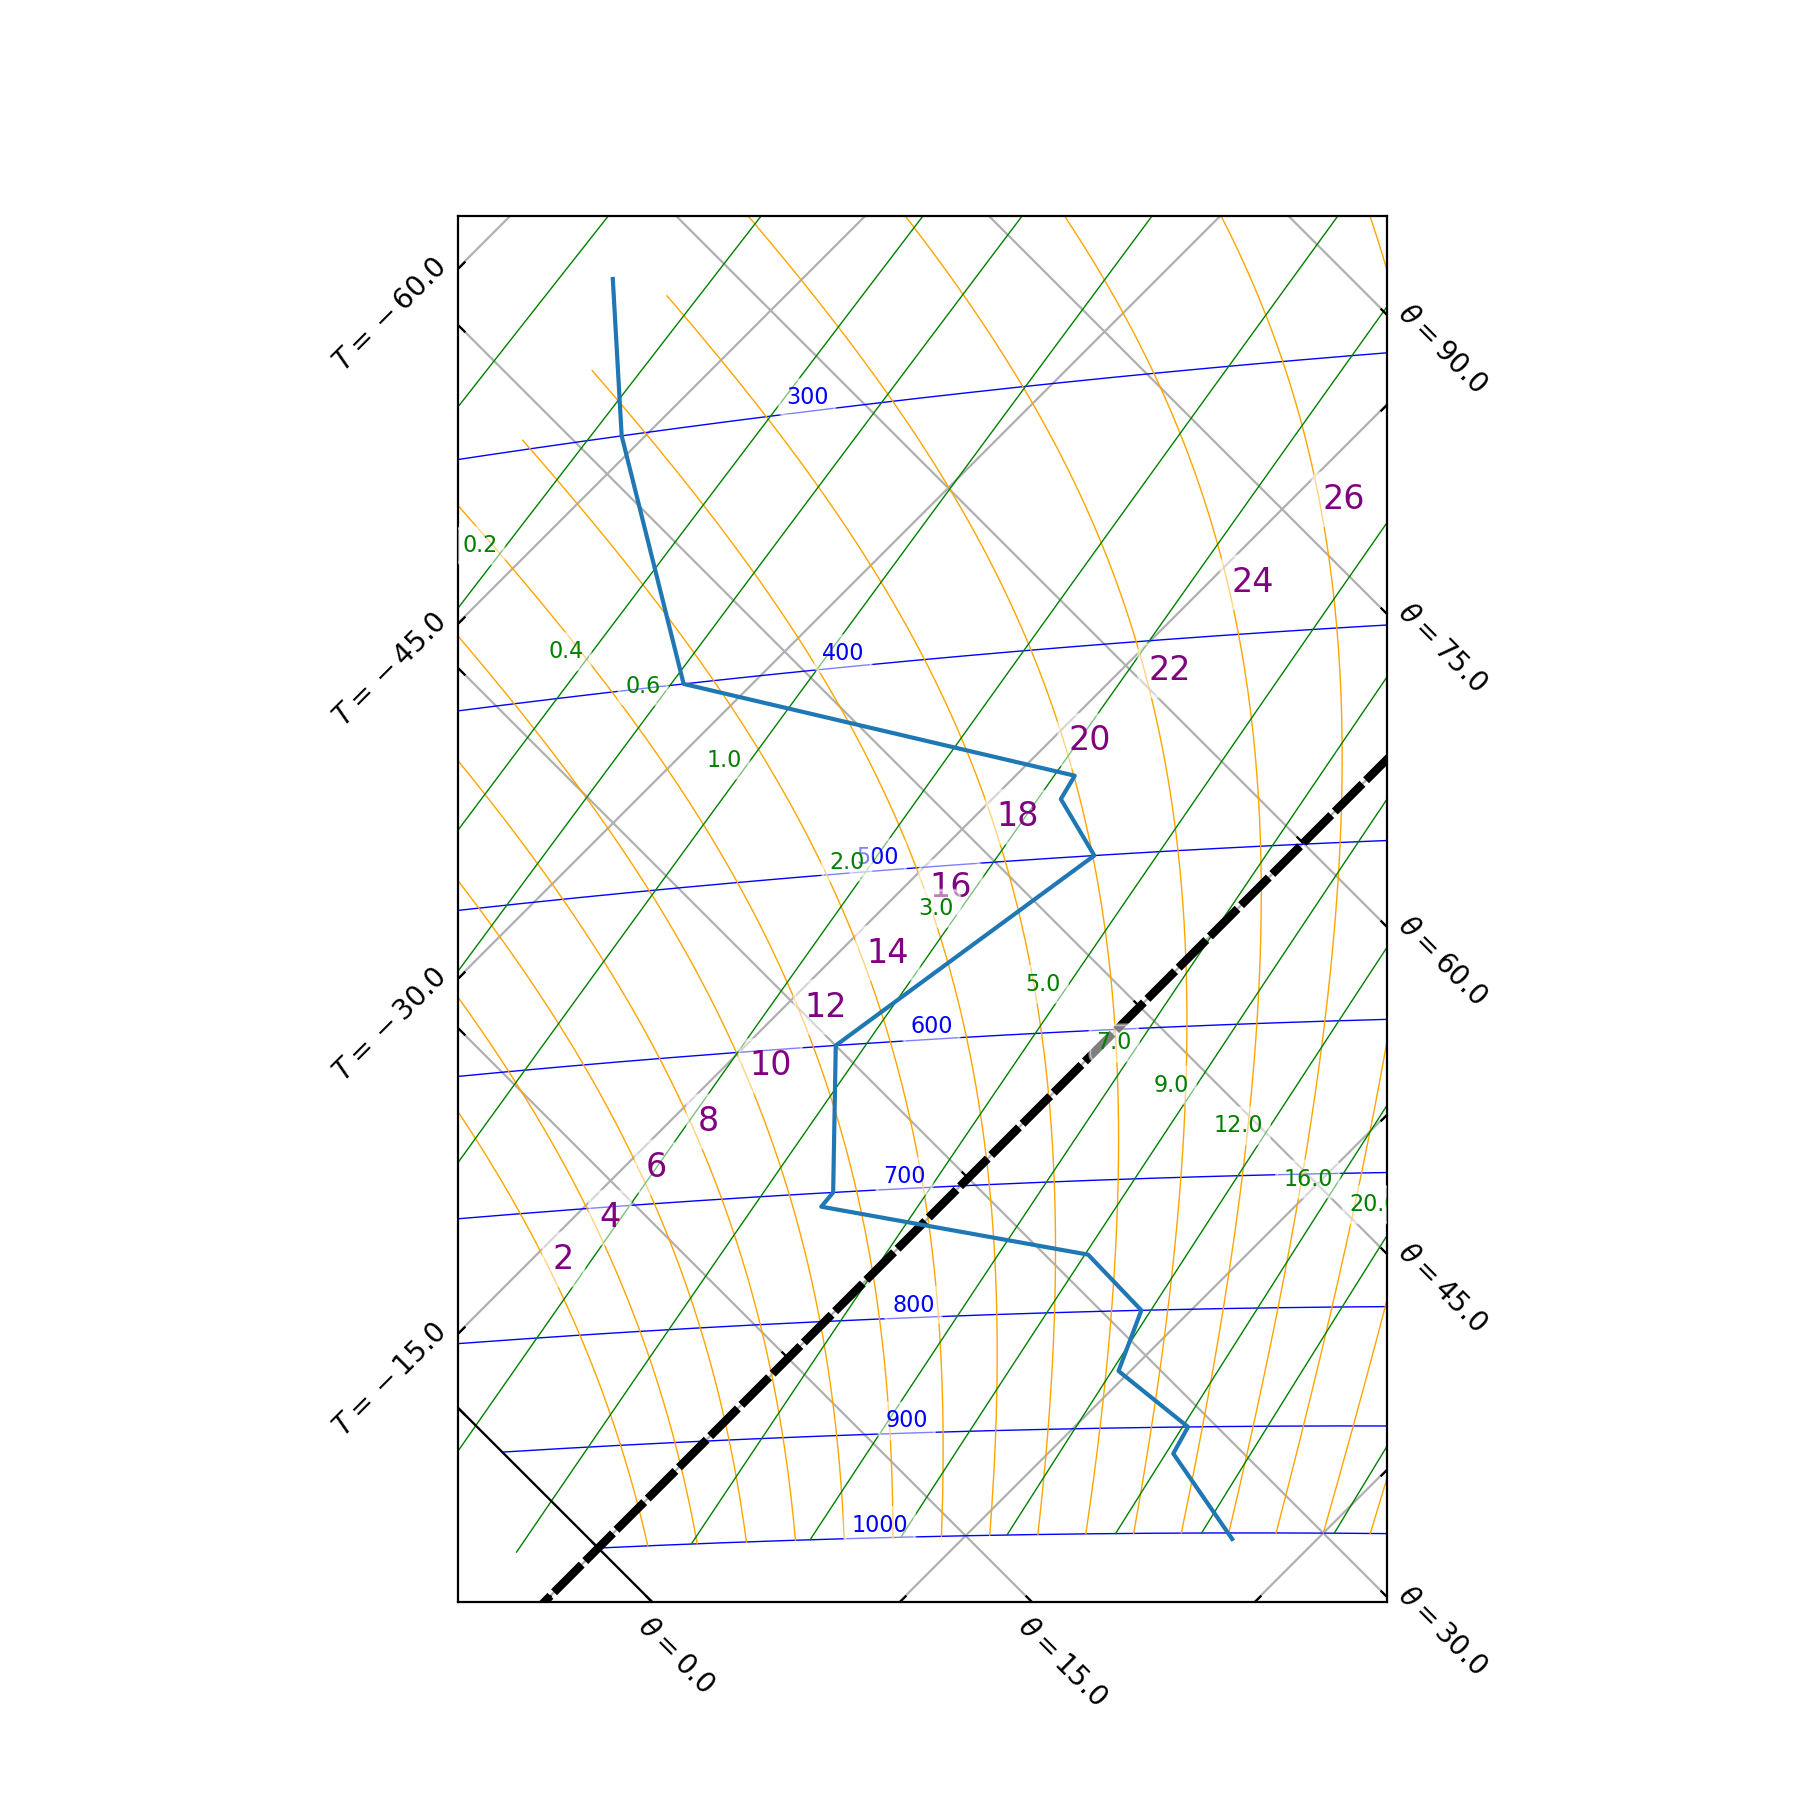
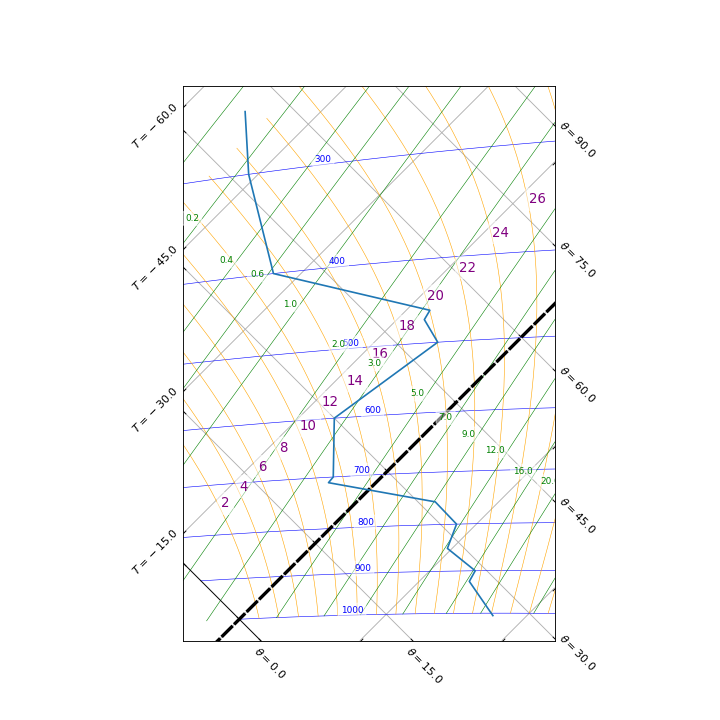
3.2.2. Saturated adiabat text
The default behavour of the tephigram saturated adiabat text is controlled by the tephi.WET_ADIABAT_TEXT dictionary:
>>> print .WET_ADIABAT_TEXT
{'color': 'orange', 'va': 'bottom', 'ha': 'left', 'clip_on': True, 'size': 8}
This is a dictionary of key and value pairs that are passed through as keyword arguments to matplotlib.pyplot.text().
Updating the WET_ADIABAT_TEXT dictionary will change the default behaviour of how the text of associated saturated adiabat lines are plotted.
import matplotlib.pyplot as plt
import os.path

import tephi

dew_point = os.path.join(tephi.DATA_DIR, 'dews.txt')
dew_data = tephi.loadtxt(dew_point, column_titles=('pressure', 'dewpoint'))
dews = zip(dew_data.pressure, dew_data.dewpoint)
tephi.WET_ADIABAT_TEXT.update({'color': 'purple', 'size': 12})
tpg = tephi.Tephigram()
tpg.plot(dews)
plt.show()
(Source code, png, hires.png, pdf)
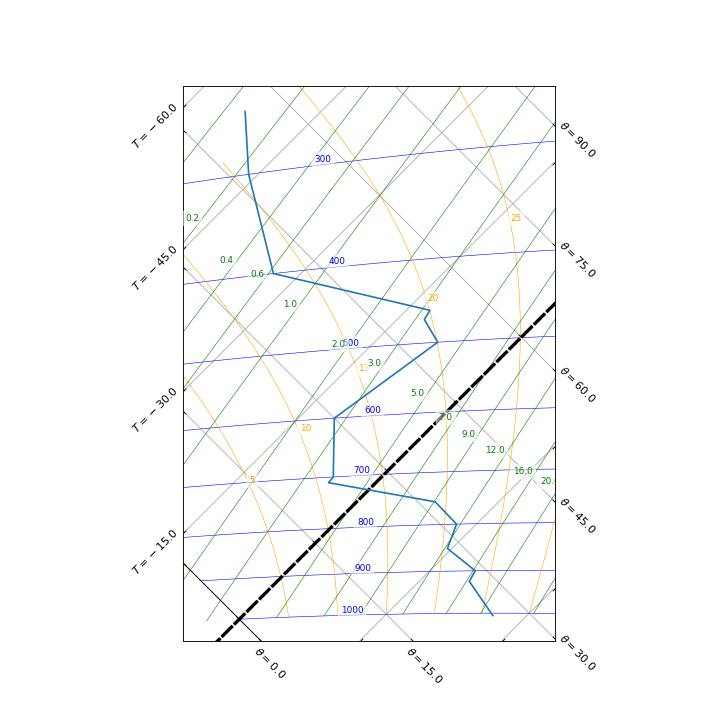
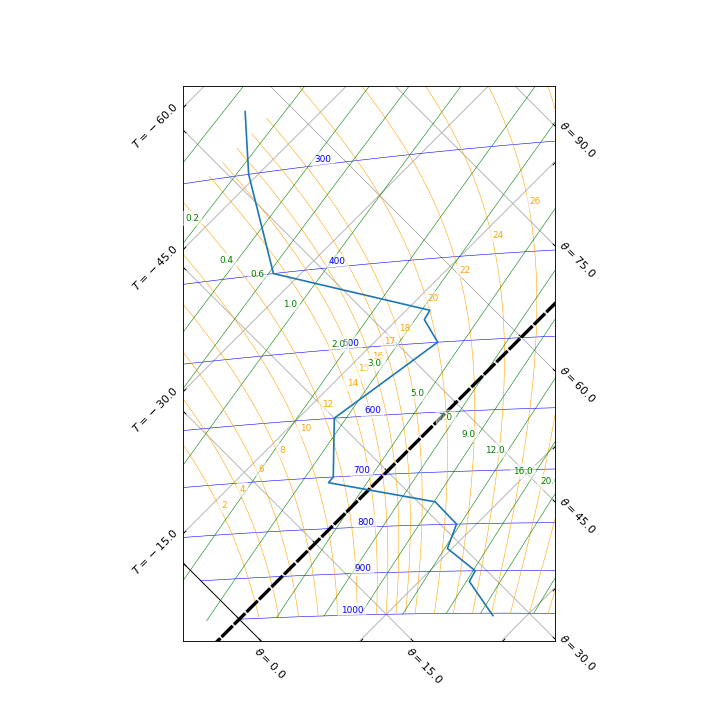
3.2.3. Saturated adiabat line frequency
The frequency at which saturated adiabat lines are plotted on the tephigram is controlled by the tephi.WET_ADIABAT_SPEC list:
>>> print .WET_ADIABAT_SPEC
[(1, 0.05), (2, 0.15), (4, 1.5)]
This line specification is a sequence of one or more tuple pairs that contain a saturated adiabat temperature line step and a zoom level.
For example, (2, 0.15) states that all saturated adiabat lines that are a multiple of 2 oC will be plotted i.e. visible,
when the zoom level is at or below 0.15.
The overall range of saturated adiabat levels that may be plotted is controlled by the tephi.MIN_WET_ADIABAT and
tephi.MAX_WET_ADIABAT variables:
>>> print tephi.MIN_WET_ADIABAT
1
>>> print tephi.MAX_WET_ADIABAT
60
Note that, it is possible to set a fixed saturated adiabat temperature line step for a tephigram plot by setting the
associated zoom level to None.
For example, to always show saturated adiabat lines that are a multiple of 5 oC, irrespective of the zoom level,
import matplotlib.pyplot as plt
import os.path

import tephi

dew_point = os.path.join(tephi.DATA_DIR, 'dews.txt')
dew_data = tephi.loadtxt(dew_point, column_titles=('pressure', 'dewpoint'))
dews = zip(dew_data.pressure, dew_data.dewpoint)
tephi.WET_ADIABAT_SPEC = [(5, None)]
tpg = tephi.Tephigram()
tpg.plot(dews)
plt.show()
(Source code, png, hires.png, pdf)
It is also possible to control which individual saturated adiabat lines should be fixed via the tephi.WET_ADIABAT_FIXED variable:
>>> print tephi.WET_ADIABAT_FIXED
None
By default, no saturated adiabat lines are fixed. To force saturated adiabat lines with a temperature of 15 oC and 17 oC
always to be plotted,
import matplotlib.pyplot as plt
import os.path

import tephi

dew_point = os.path.join(tephi.DATA_DIR, 'dews.txt')
dew_data = tephi.loadtxt(dew_point, column_titles=('pressure', 'dewpoint'))
dews = zip(dew_data.pressure, dew_data.dewpoint)
tephi.WET_ADIABAT_FIXED = [15, 17]
tpg = tephi.Tephigram()
tpg.plot(dews)
plt.show()
(Source code, png, hires.png, pdf)

3.3. Humidity mixing ratio control
3.3.1. Humidity mixing ratio lines
The default behaviour of the tephigram humidity mixing ratio line is controlled by the tephi.MIXING_RATIO_LINE dictionary:
>>> print tephi.MIXING_RATIO_LINE
{'color': 'green', 'linewidth': 0.5, 'clip_on': True}
This is a dictionary of key and value pairs that are passed through as keyword arguments to matplotlib.pyplot.plot().
Updating the MIXING_RATIO_LINE dictionary will change the default behaviour of all humidity mixing ratio line plotting.
import matplotlib.pyplot as plt
import os.path
import tephi
dew_point = os.path.join(tephi.DATA_DIR, 'dews.txt')
dew_data = tephi.loadtxt(dew_point, column_titles=('pressure', 'dewpoint'))
dews = zip(dew_data.pressure, dew_data.dewpoint)
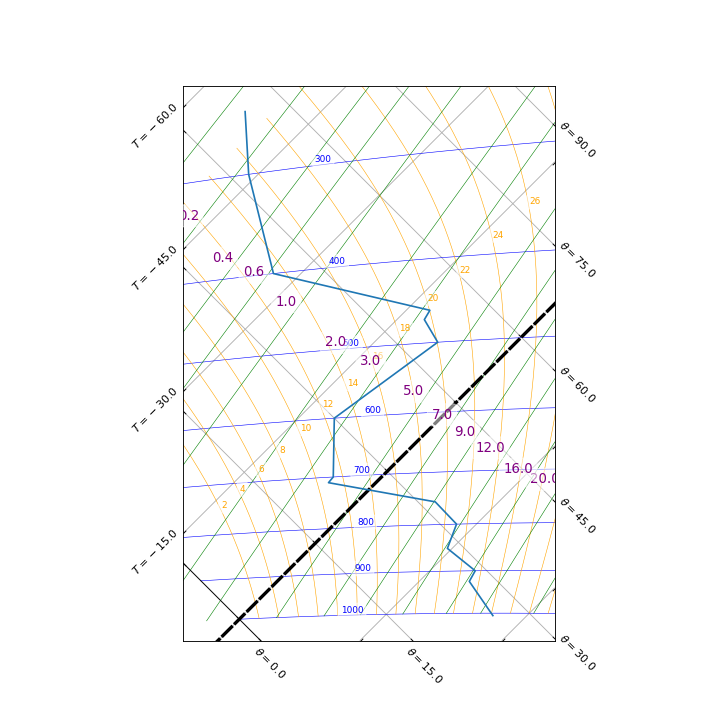
tephi.MIXING_RATIO_LINE.update({'color': 'purple', 'linewidth': 3, 'linestyle': '--'})
tpg = tephi.Tephigram()
tpg.plot(dews)
plt.show()
(Source code, png, hires.png, pdf)

3.3.2. Humidity mixing ratio text
The default behaviour of the tephigram humidity mixing ratio text is controlled by the tephi.MIXING_RATIO_TEXT dictionary:
>>> print tephi.MIXING_RATIO_TEXT
{'color': 'green', 'va': 'bottom', 'ha': 'right', 'clip_on': True, 'size': 8}
This is a dictionary of key and value pairs that are passed through as keyword arguments to matplotlib.pyplot.text().
Updating the MIXING_RATIO_TEXT dictionary will change the default behaviour of how the text of associated humidity mixing ratio lines are plotted.
import matplotlib.pyplot as plt
import os.path

import tephi

dew_point = os.path.join(tephi.DATA_DIR, 'dews.txt')
dew_data = tephi.loadtxt(dew_point, column_titles=('pressure', 'dewpoint'))
dews = zip(dew_data.pressure, dew_data.dewpoint)
tephi.MIXING_RATIO_TEXT.update({'color': 'purple', 'size': 12})
tpg = tephi.Tephigram()
tpg.plot(dews)
plt.show()
(Source code, png, hires.png, pdf)
3.3.3. Humidity mixing ratio line frequency
The frequency at which humidity mixing ratio lines are plotted on the tephigram is controlled by the tephi.MIXING_RATIO_SPEC list:
>>> print tephi.MIXING_RATIO_SPEC
[(1, 0.05), (2, 0.18), (4, 0.3), (8, 1.5)]
This line specification is a sequence of one or more tuple pairs that contain a humidity mixing ratio line step and a zoom level.
For example, (4, 0.3) states that every fourth humidity mixing ratio line will be plotted i.e. visible, when the zoom level
is at or below 0.3.
The overall range of humidity mixing ratio levels that may be plotted is controlled by the tephi.MIXING_RATIOS list:
>>> print tephi.MIXING_RATIOS
[0.001, 0.002, 0.005, 0.01, 0.02, 0.03, 0.05, 0.1, 0.15, 0.2, 0.3, 0.4, 0.5, 0.6, 0.8, 1.0, 1.5, 2.0, 2.5, 3.0, 4.0, 5.0, 6.0, 7.0, 8.0, 9.0, 10.0, 12.0, 14.0, 16.0, 18.0, 20.0, 24.0, 28.0, 32.0, 36.0, 40.0, 44.0, 48.0, 52.0, 56.0, 60.0, 68.0, 80.0]
Note that, it is possible to control which individual humidity mixing ratio lines should be fixed i.e. always visible, via the tephi.MIXING_RATIO_FIXED variable:
>>> print tephi.MIXING_RATIO_FIXED
None
By default, no humidity mixing ratio lines are fixed. To force humidity mixing ratio lines 4.0 g kg-1 and 6.0 g kg-1always to be plotted independent of the zoom level,
import matplotlib.pyplot as plt
import os.path

import tephi

dew_point = os.path.join(tephi.DATA_DIR, 'dews.txt')
dew_data = tephi.loadtxt(dew_point, column_titles=('pressure', 'dewpoint'))
dews = zip(dew_data.pressure, dew_data.dewpoint)
tephi.MIXING_RATIO_FIXED = [4.0, 6.0]
tpg = tephi.Tephigram()
tpg.plot(dews)
plt.show()
(Source code, png, hires.png, pdf)