4. Tephigram barbs
This section discusses how wind barbs may be plotted on a tephigram.
4.1. Wind barbs
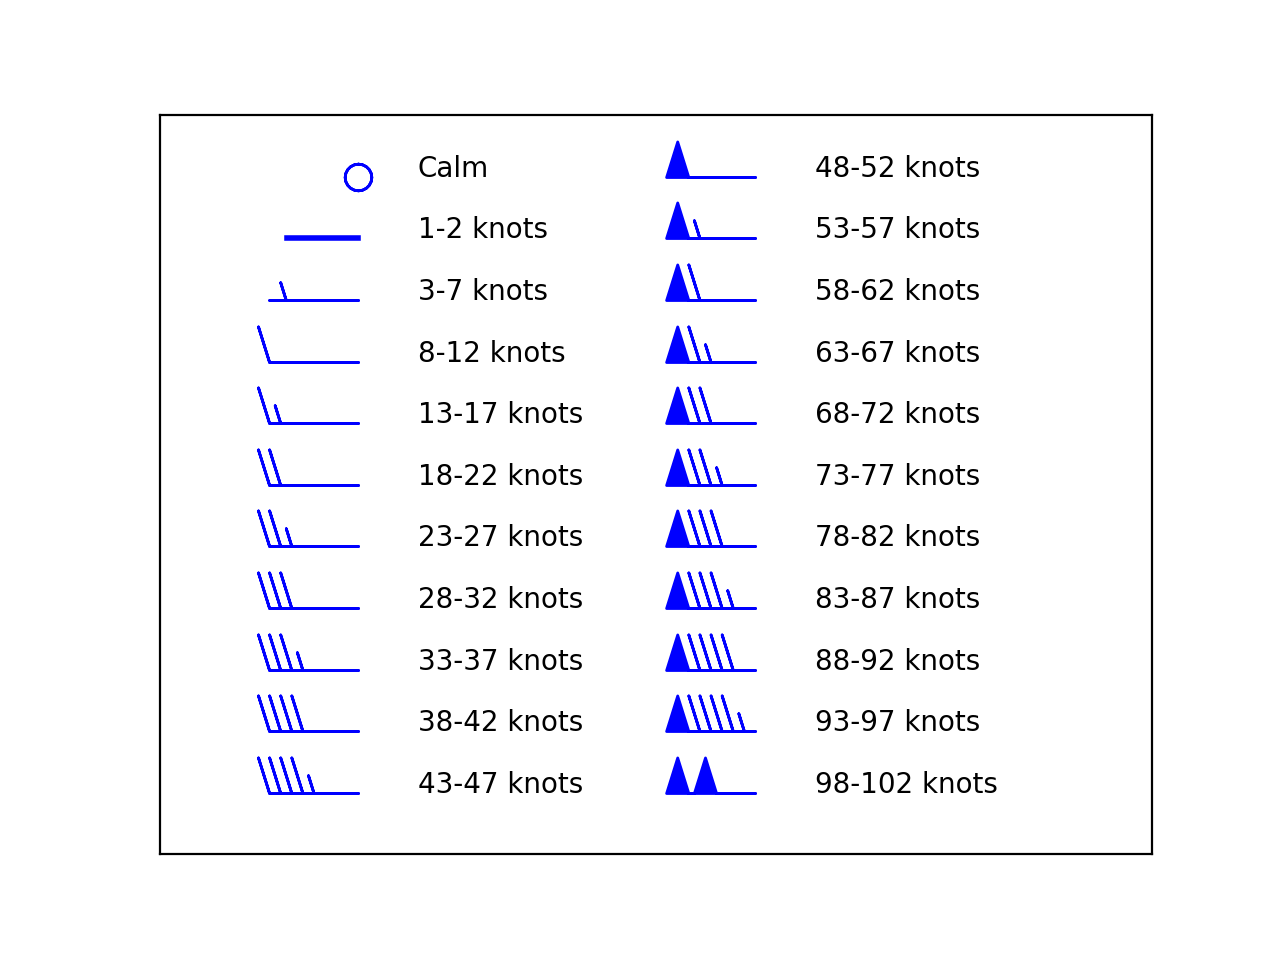
Tephigram plots may be decorated with barbs to indicate wind speed and wind direction at specific pressure levels. The following barb symbology has been adopted, as defined and used by the Met Office since 1 January 1955. See Met Office National Meteorological Library and Archive, Fact Sheet No. 11 - Interpreting weather charts.
(Source code, png, hires.png, pdf)
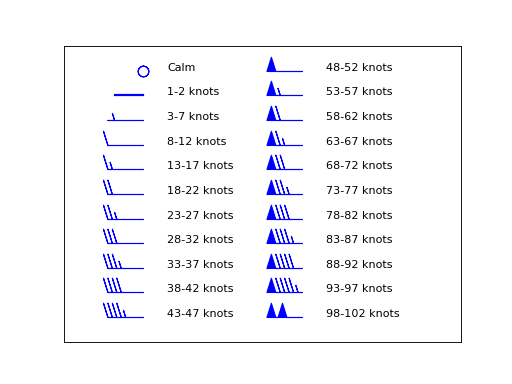
Wind direction is indicated by the orientation of the barb on the plot, where north is 0o, east is 90o, south is 180oand west is 270o.
4.2. Plotting barbs
A profile must be first plotted before the barbs are associated with that profile.
import matplotlib.pyplot as plt
import os.path
import tephi
dew_point = os.path.join(tephi.DATA_DIR, 'dews.txt')
dew_data = tephi.loadtxt(dew_point, column_titles=('pressure', 'dewpoint'))
dews = zip(dew_data.pressure, dew_data.dewpoint)
tpg = tephi.TephiAxes()
profile = tpg.plot(dews)
barbs = [(0, 0, 900), (1, 30, 850), (5, 60, 800),
(10, 90, 750), (15, 120, 700), (20, 150, 650),
(25, 180, 600), (30, 210, 550), (35, 240, 500),
(40, 270, 450), (45, 300, 400), (50, 330, 350),
(55, 360, 300)]
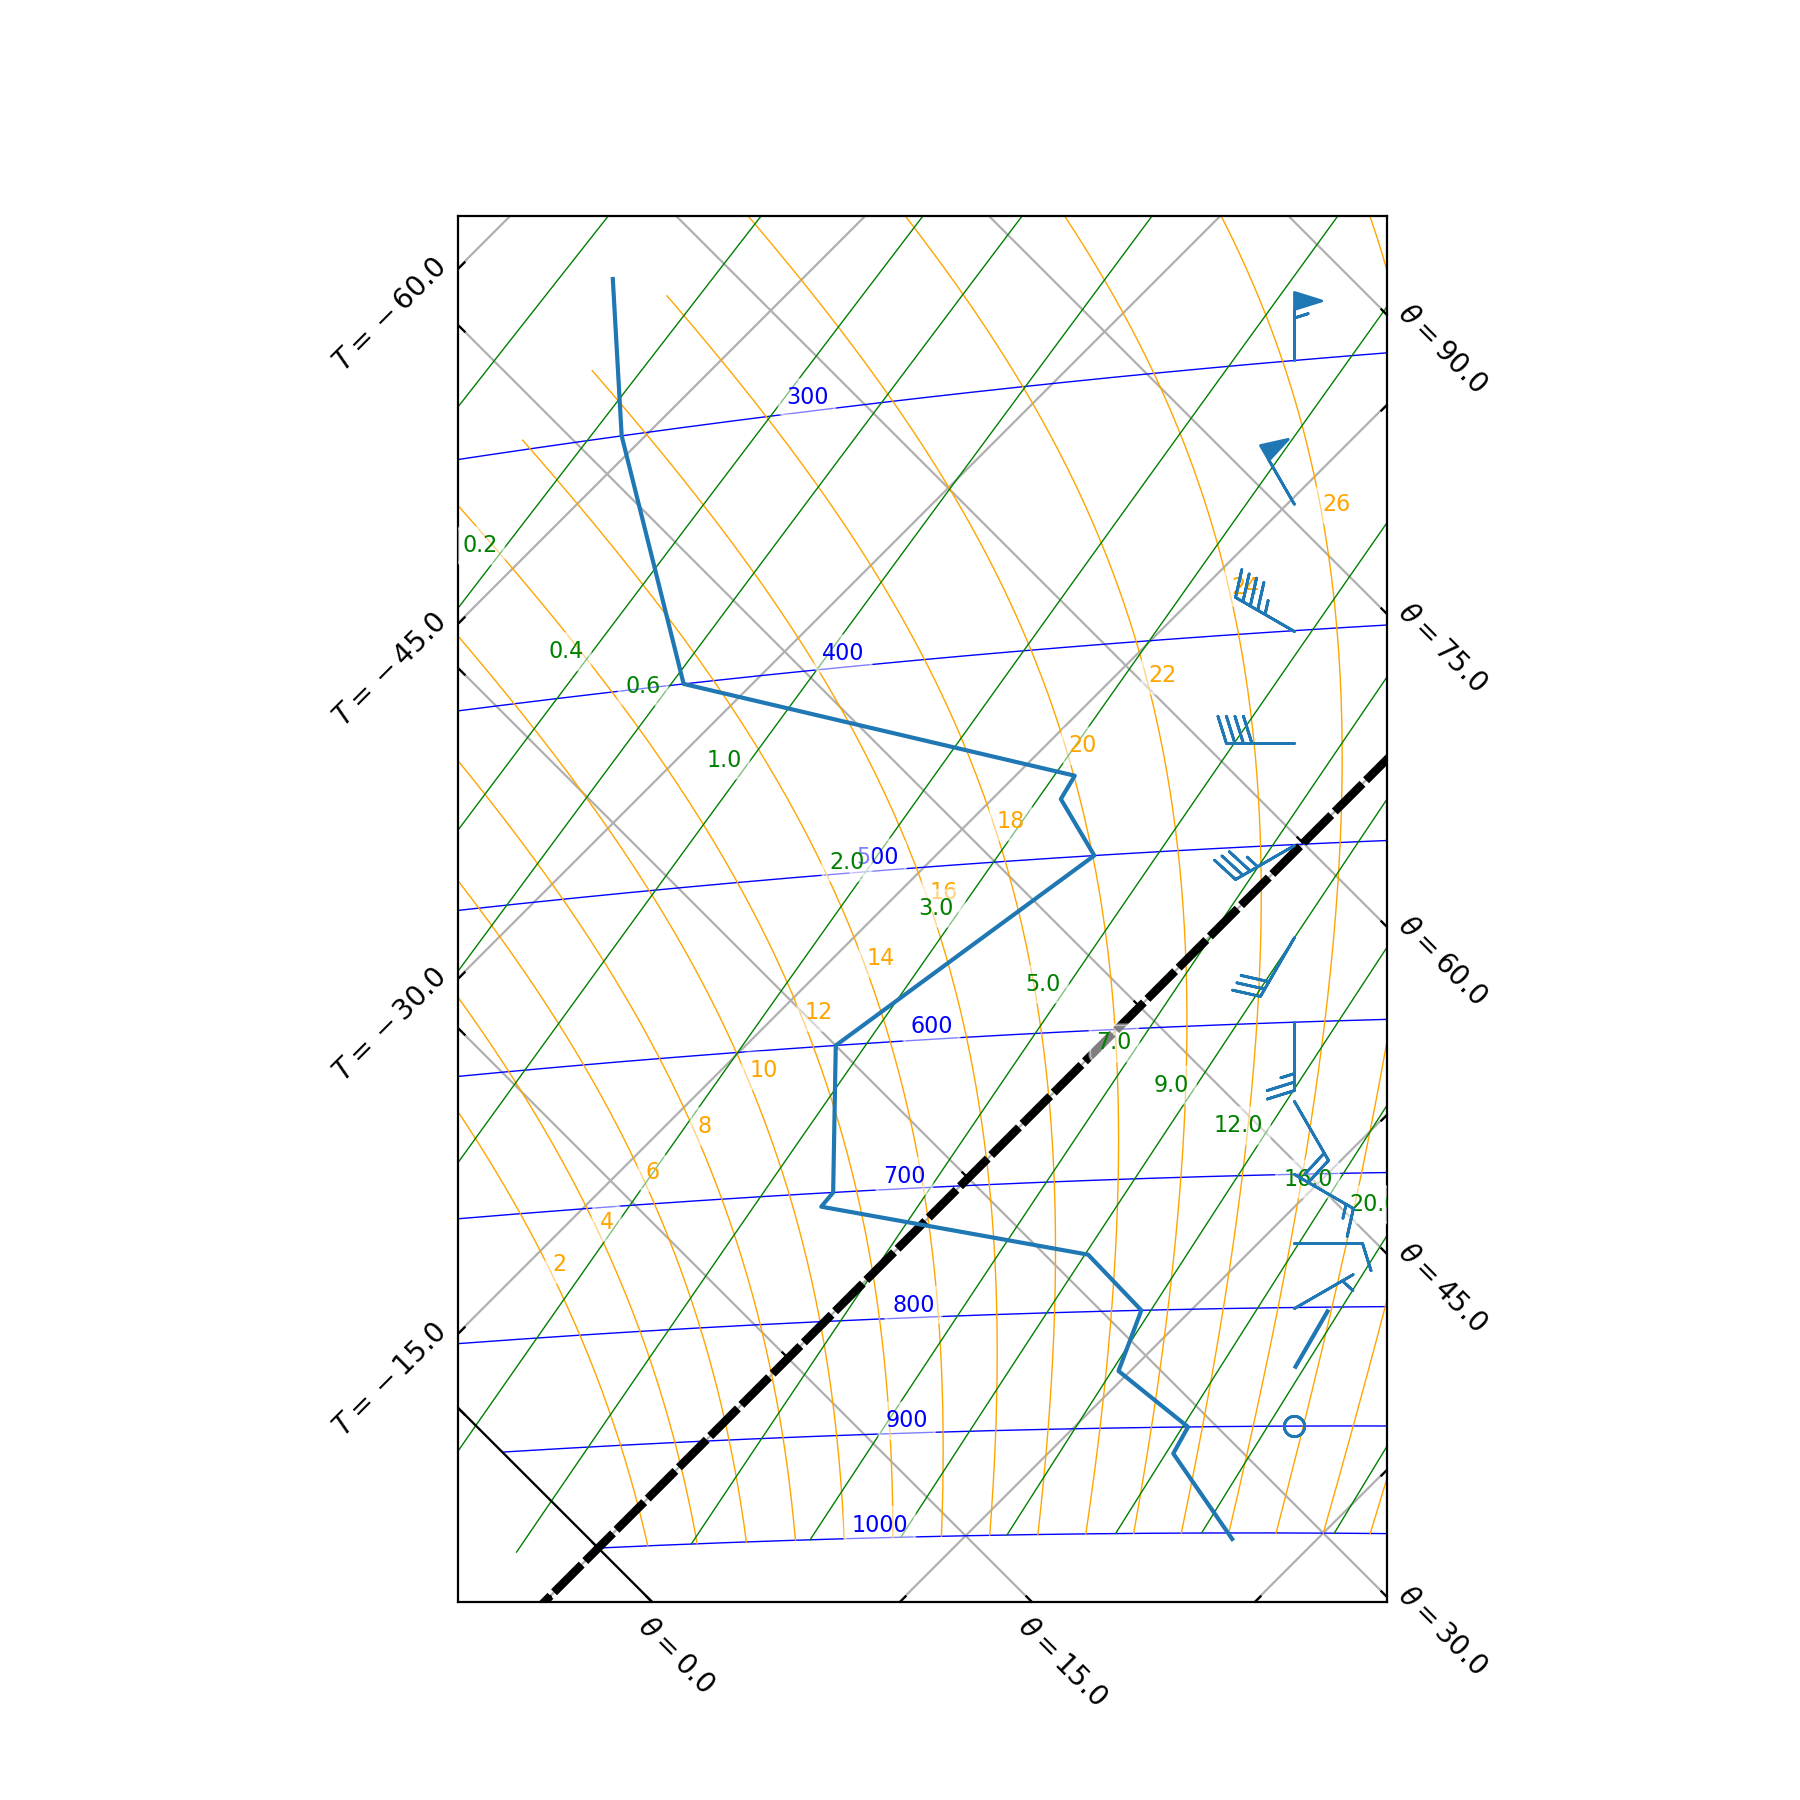
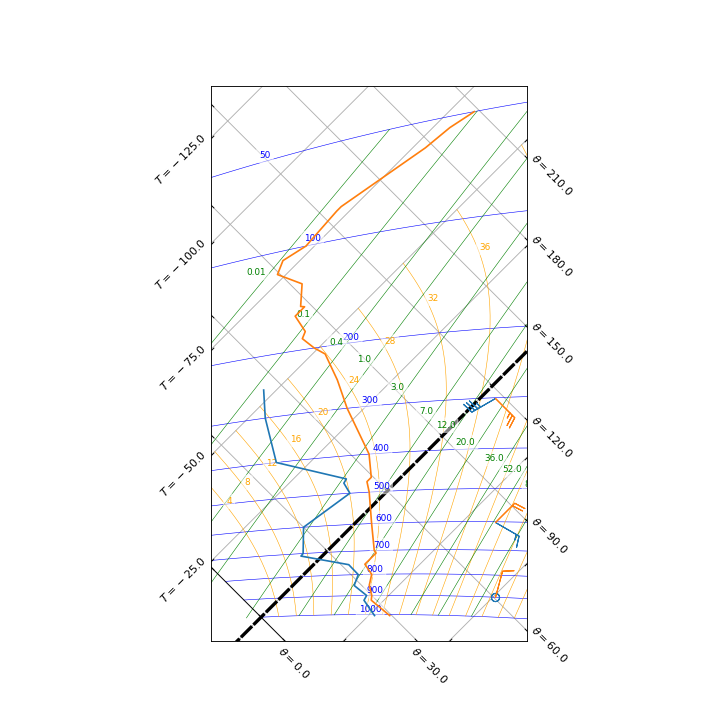
profile.barbs(barbs)
plt.show()
(Source code, png, hires.png, pdf)
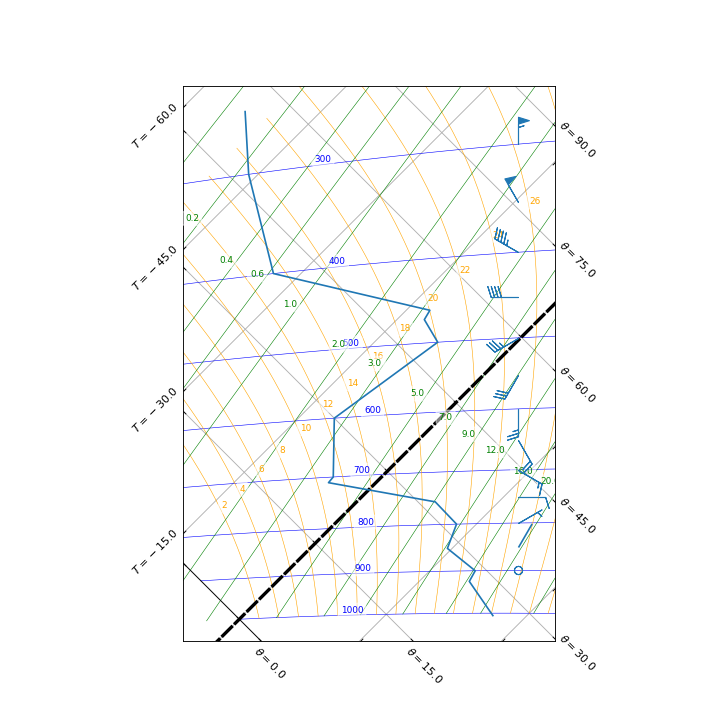
A single barb is specified using a triple denoting the wind speed, wind direction and pressure level. For example, the following triple (10, 90, 750) represents a wind speed of 10 knots, directly from the east, and at an atmospheric pressure of 750 mb.
Note that, the barbs default to the same colour as their associated profile.
import matplotlib.pyplot as plt
import os.path
import tephi
dew_point = os.path.join(tephi.DATA_DIR, 'dews.txt')
dry_bulb = os.path.join(tephi.DATA_DIR, 'temps.txt')
column_titles = [('pressure', 'dewpoint'), ('pressure', 'temperature')]
dew_data, temp_data = tephi.loadtxt(dew_point, dry_bulb, column_titles=column_titles)
dews = zip(dew_data.pressure, dew_data.dewpoint)
temps = zip(temp_data.pressure, temp_data.temperature)
tpg = tephi.TephiAxes()
dprofile = tpg.plot(dews)
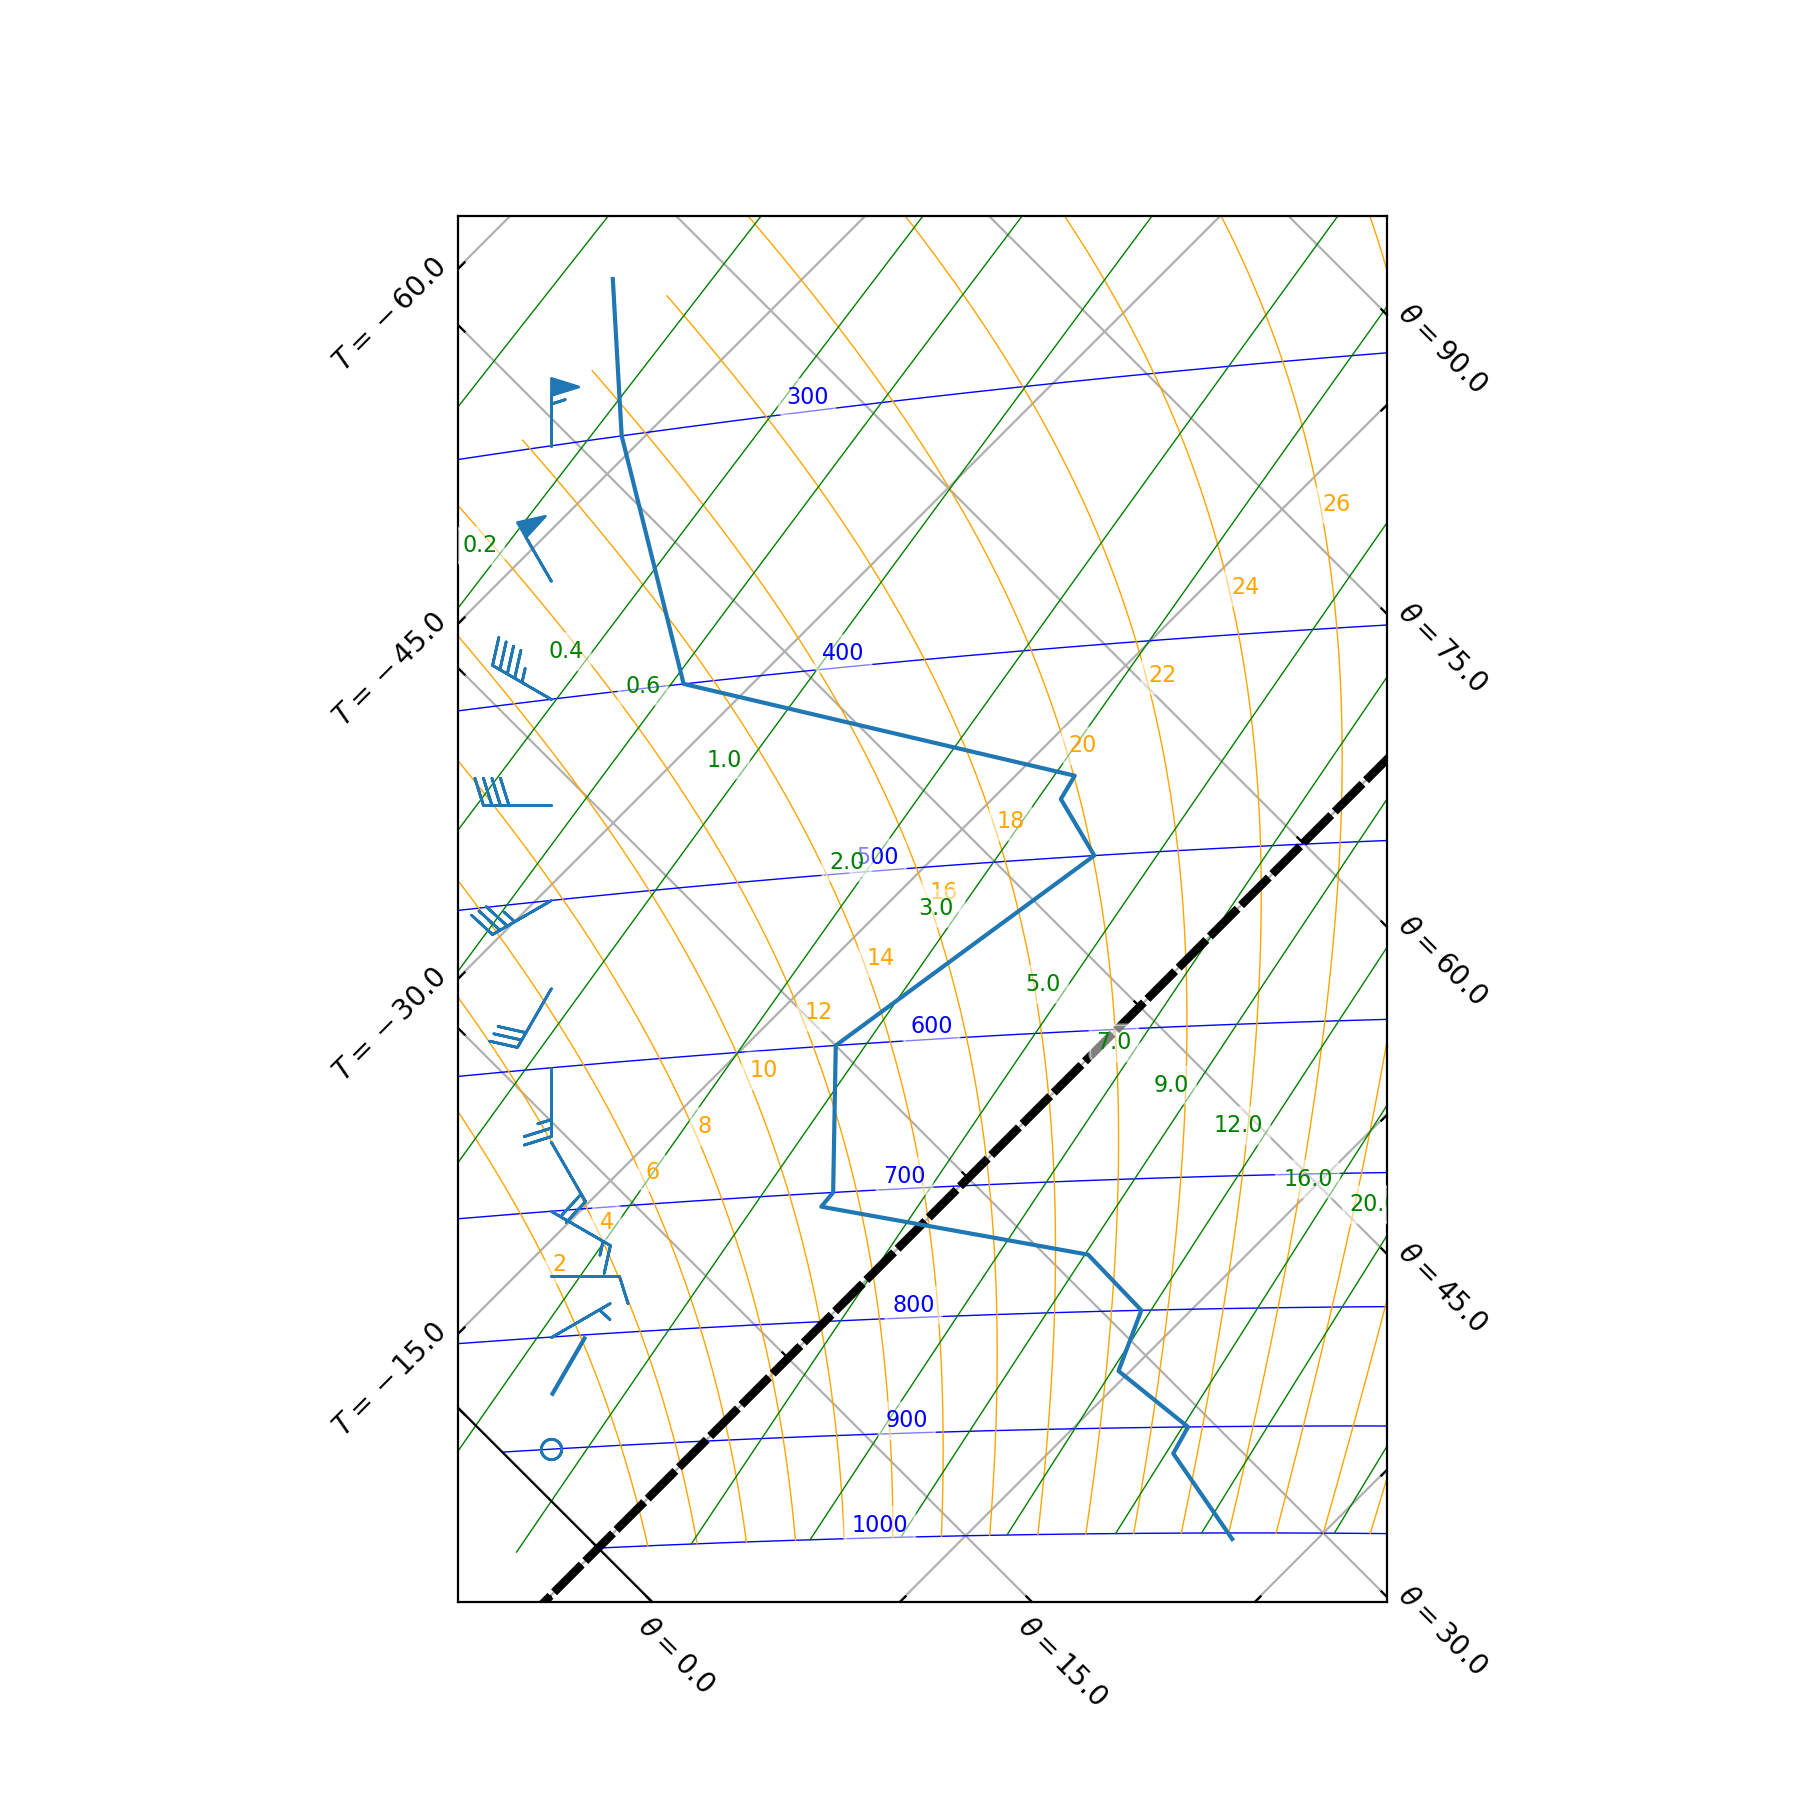
dbarbs = [(0, 0, 900), (15, 120, 600), (35, 240, 300)]
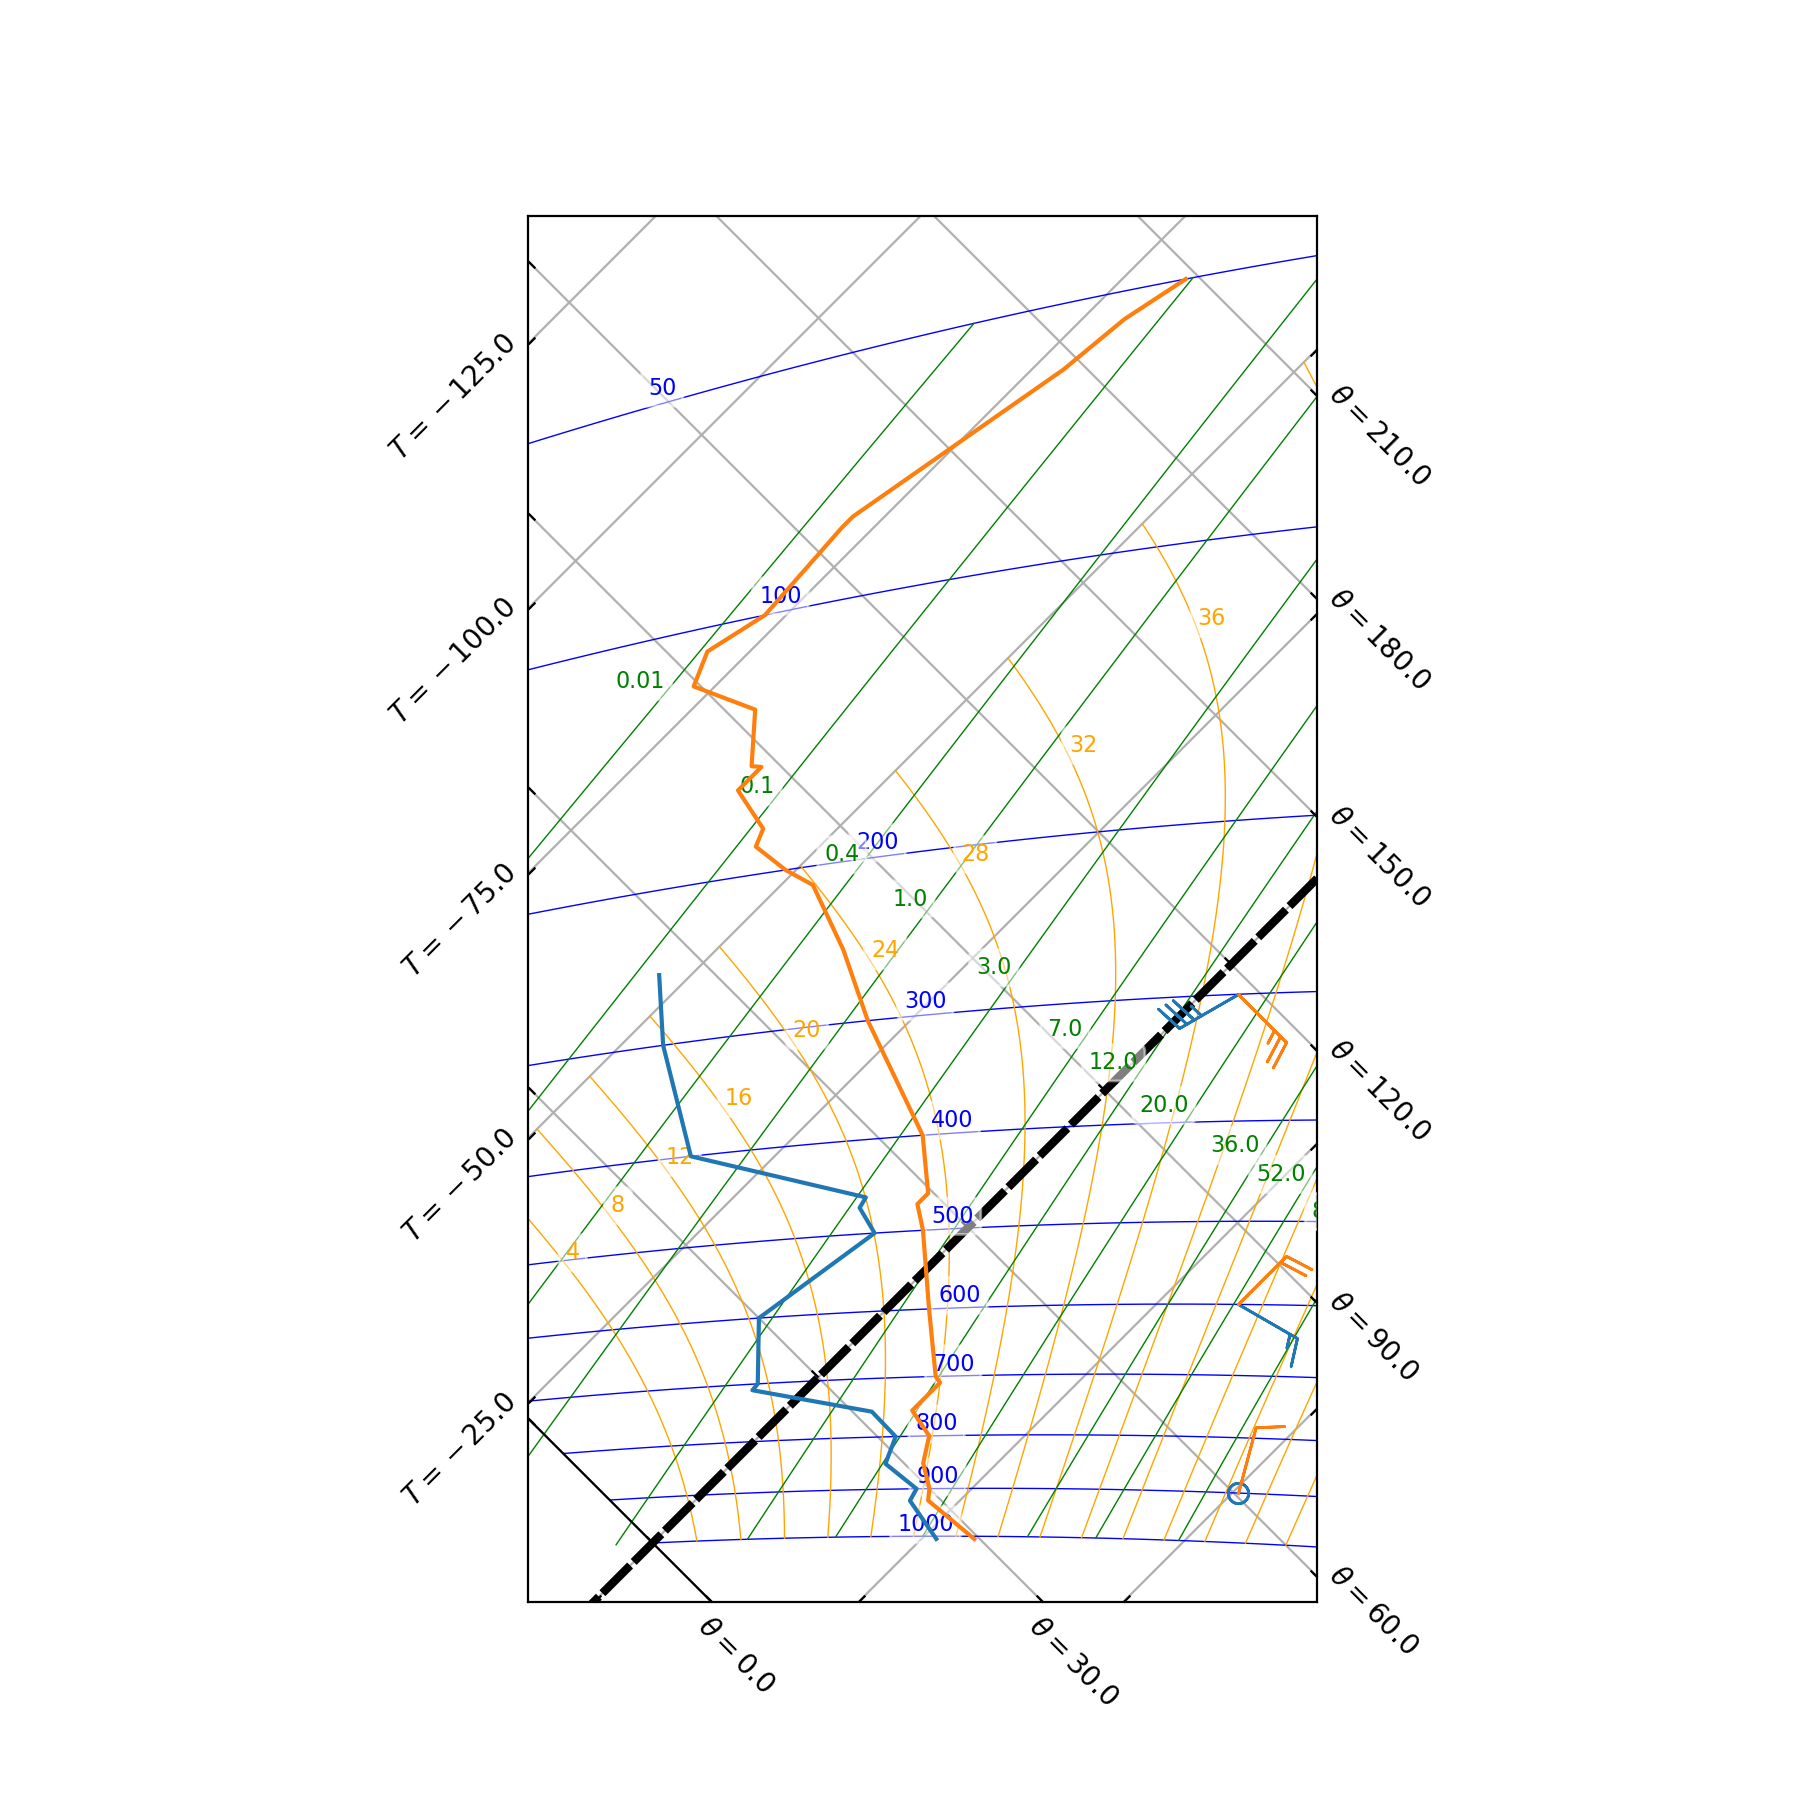
dprofile.barbs(dbarbs)
tprofile = tpg.plot(temps)
tbarbs = [(10, 15, 900), (21, 45, 600), (25, 135, 300)]
tprofile.barbs(tbarbs)
plt.show()
(Source code, png, hires.png, pdf)

Barbs may also be plotted using wind speed and wind direction data (associated with a pressure level) in a text file.
import matplotlib.pyplot as plt
import os.path

import tephi

winds = os.path.join(tephi.DATA_DIR, 'barbs.txt')
column_titles = ('pressure', 'dewpoint', 'wind_speed', 'wind_direction')
barb_data = tephi.loadtxt(winds, column_titles=column_titles)
dews = zip(barb_data.pressure, barb_data.dewpoint)
barbs = zip(barb_data.wind_speed, barb_data.wind_direction, barb_data.pressure)
tpg = tephi.TephiAxes()
profile = tpg.plot(dews)
profile.barbs(barbs)
plt.show()
(Source code, png, hires.png, pdf)
4.3. Controlling the barbs
All keyword arguments passed to tephi.isopleths.Profile.barbs() are simply passed through to matplotlib.pyplot.barbs().
This transparency allows full control when plotting barbs on the tephigram.
import matplotlib.pyplot as plt
import os.path
import tephi
dew_point = os.path.join(tephi.DATA_DIR, 'dews.txt')
dew_data = tephi.loadtxt(dew_point, column_titles=('pressure', 'dewpoint'))
dews = zip(dew_data.pressure, dew_data.dewpoint)
tpg = tephi.TephiAxes()
profile = tpg.plot(dews)
barbs = [(0, 0, 900), (1, 30, 850), (5, 60, 800),
(10, 90, 750), (15, 120, 700), (20, 150, 650),
(25, 180, 600), (30, 210, 550), (35, 240, 500),
(40, 270, 450), (45, 300, 400), (50, 330, 350),
(55, 360, 300)]
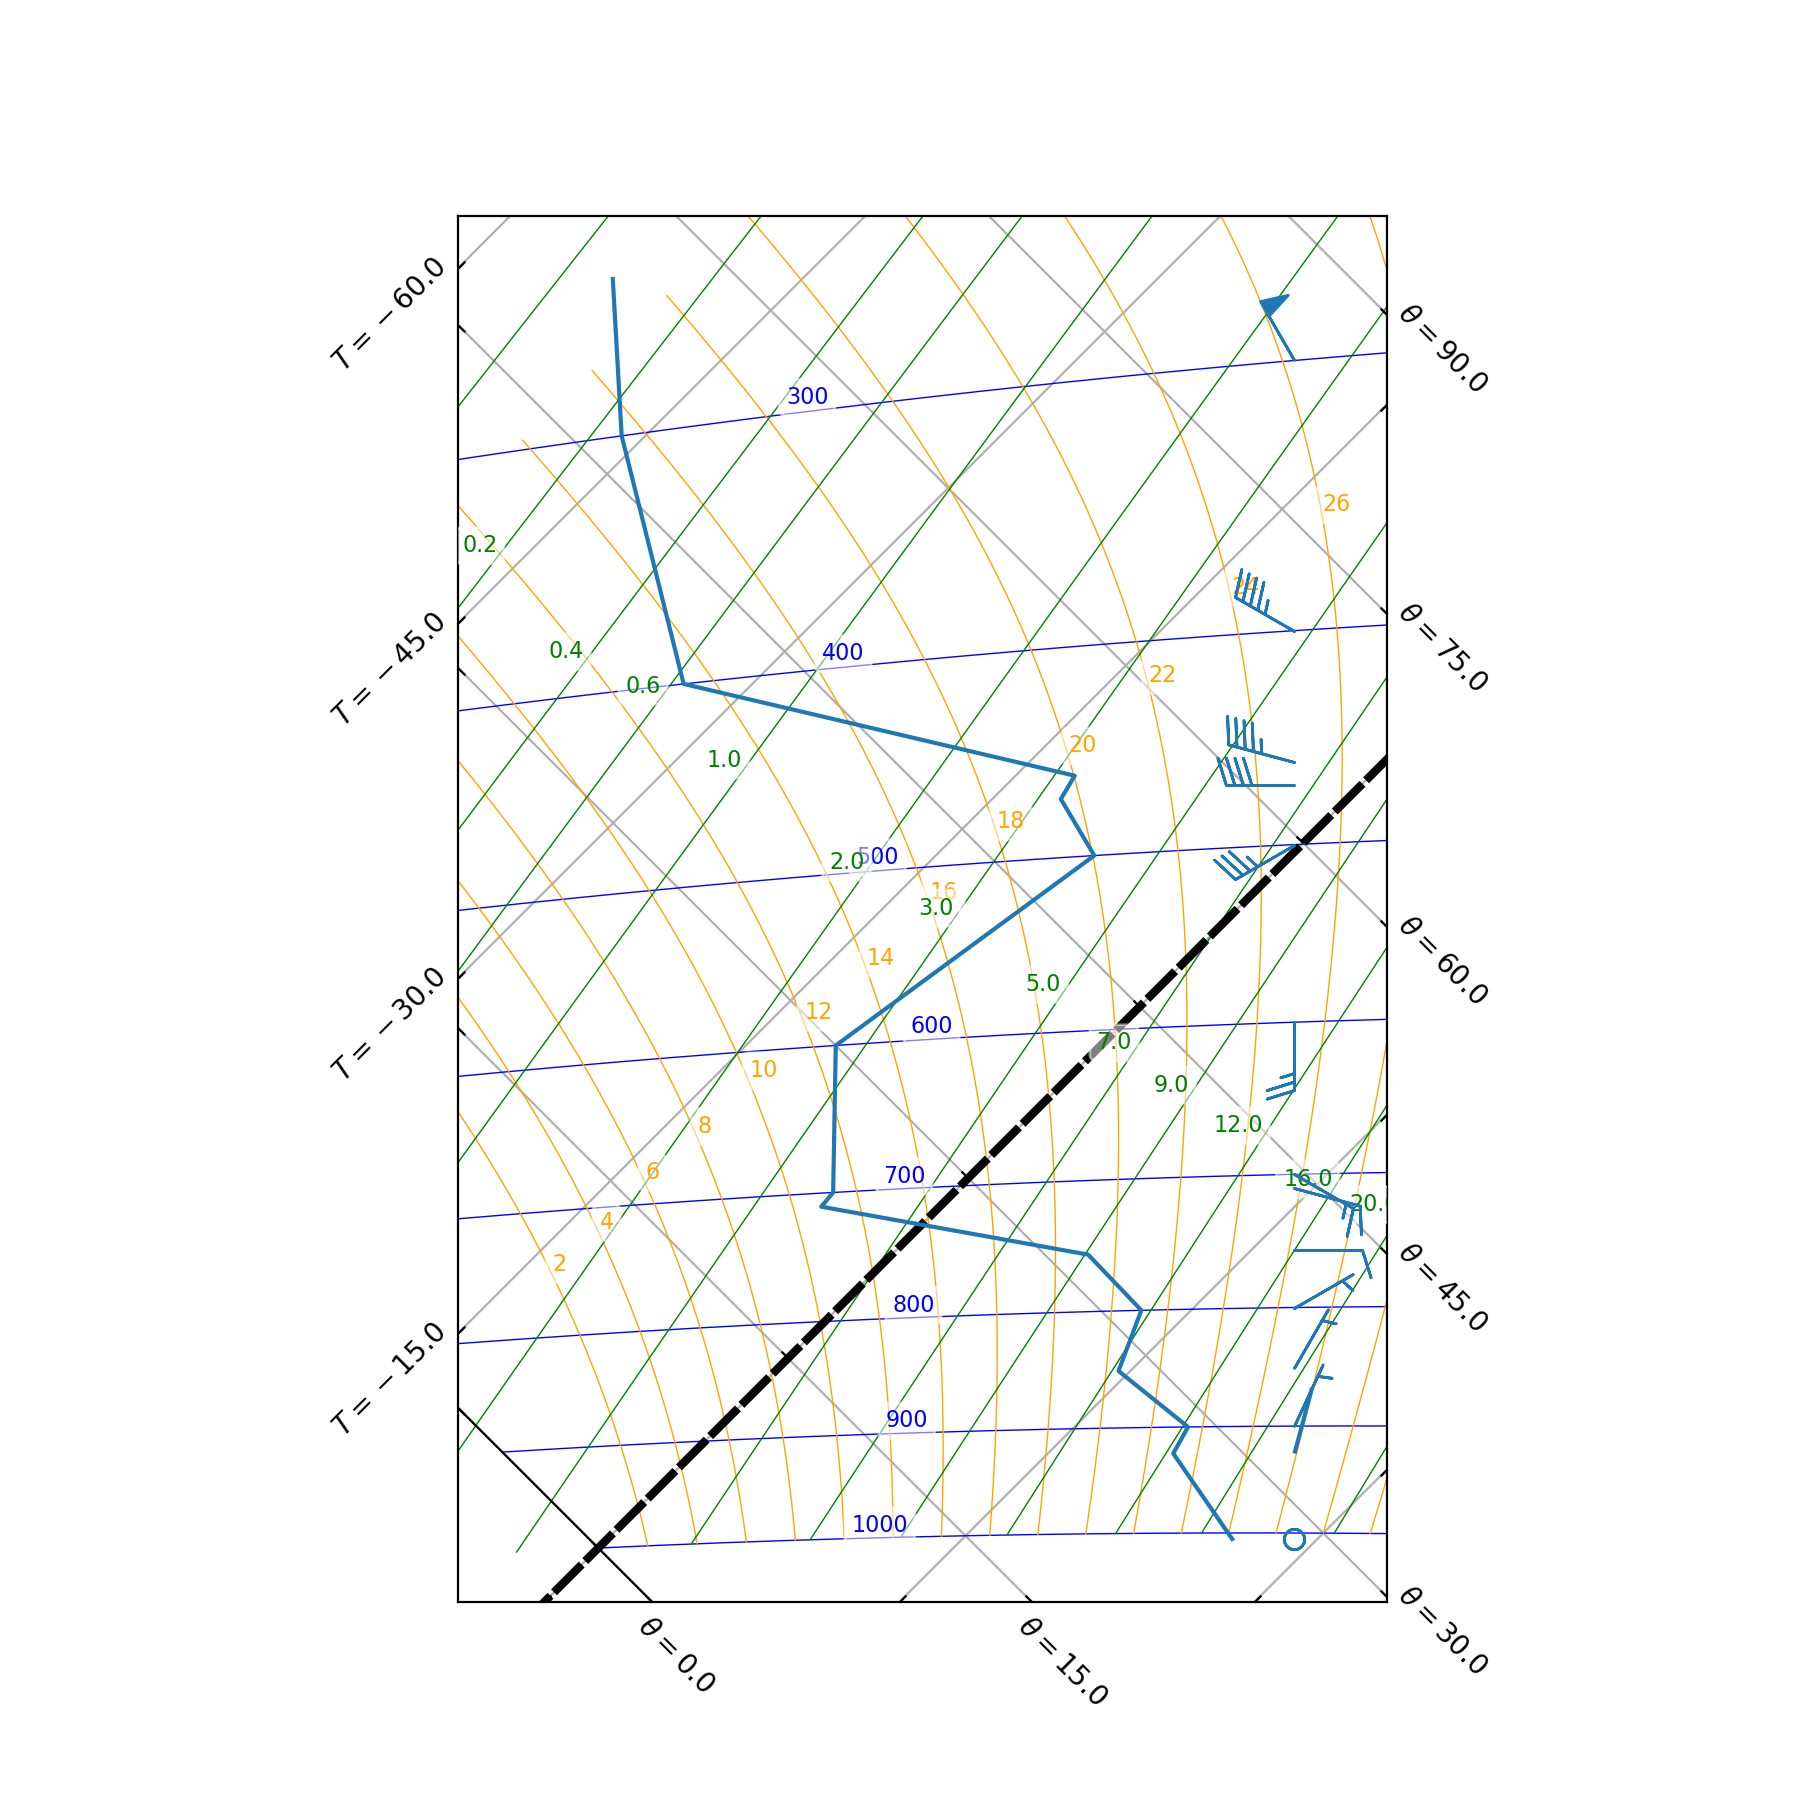
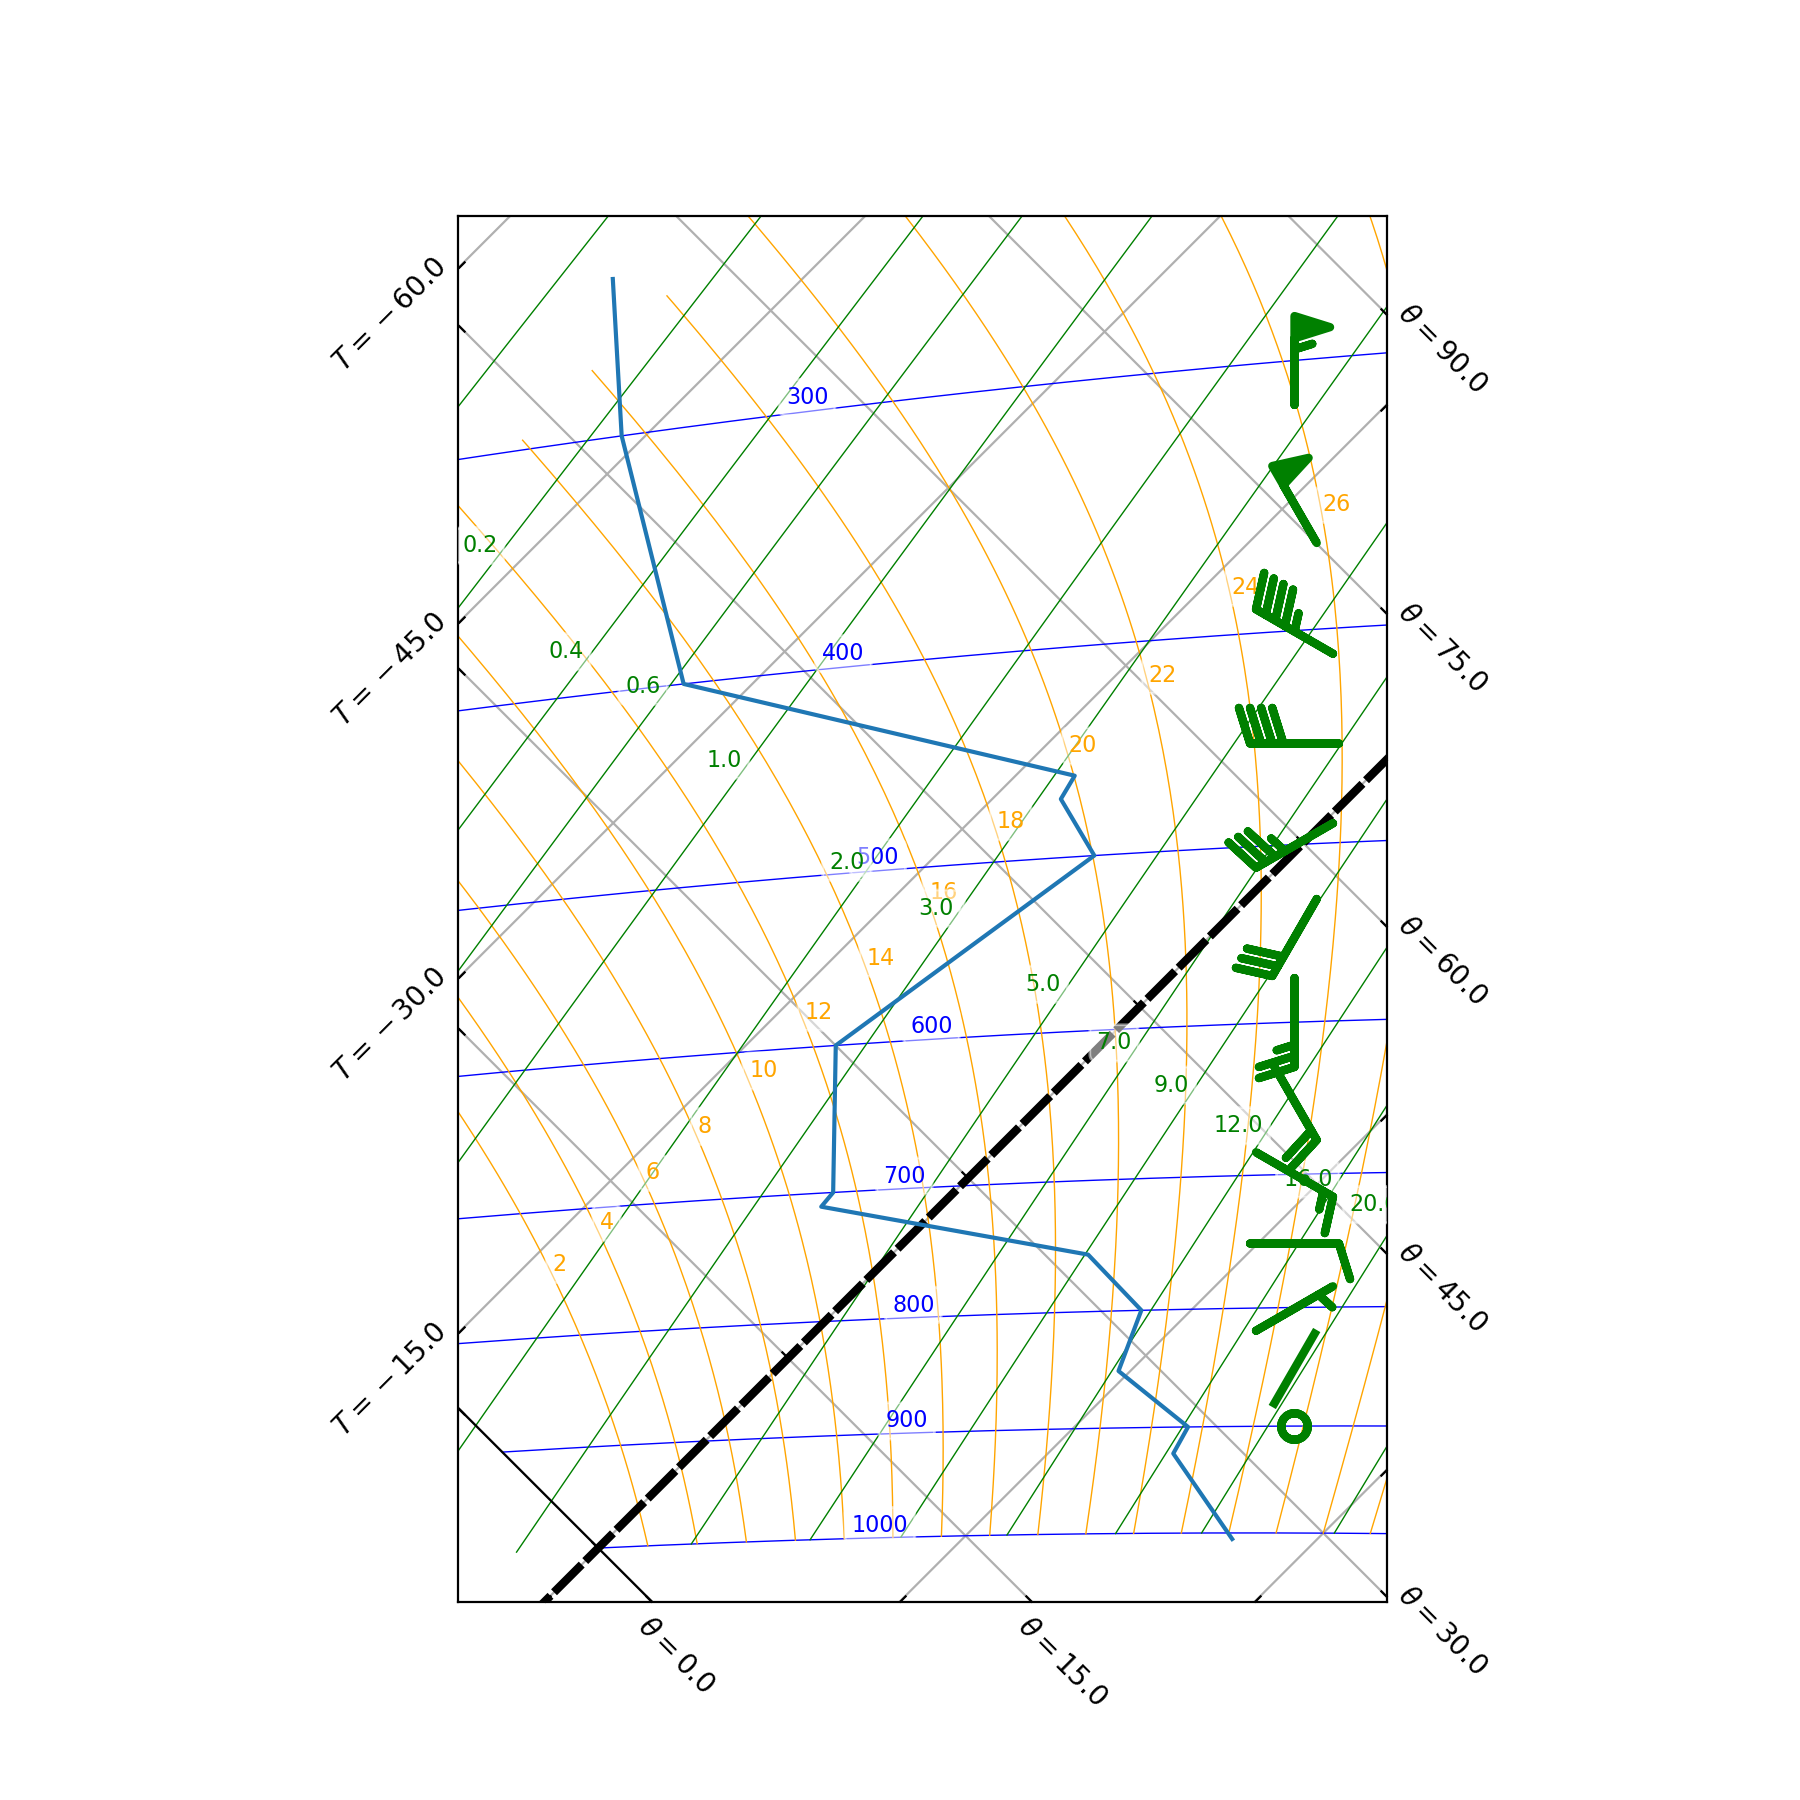
profile.barbs(barbs, length=8, pivot='middle', color='green', linewidth=3)
plt.show()
(Source code, png, hires.png, pdf)
4.4. Moving the gutter
By default, the barbs are plotted on the right hand side of the tephigram. The position of the barb gutter can easily be controlled via the gutter keyword argument to tephi.isopleths.Profile.barbs().
import matplotlib.pyplot as plt
import os.path
import tephi
dew_point = os.path.join(tephi.DATA_DIR, 'dews.txt')
dew_data = tephi.loadtxt(dew_point, column_titles=('pressure', 'dewpoint'))
dews = zip(dew_data.pressure, dew_data.dewpoint)
tpg = tephi.TephiAxes()
profile = tpg.plot(dews)
barbs = [(0, 0, 900), (1, 30, 850), (5, 60, 800),
(10, 90, 750), (15, 120, 700), (20, 150, 650),
(25, 180, 600), (30, 210, 550), (35, 240, 500),
(40, 270, 450), (45, 300, 400), (50, 330, 350),
(55, 360, 300)]
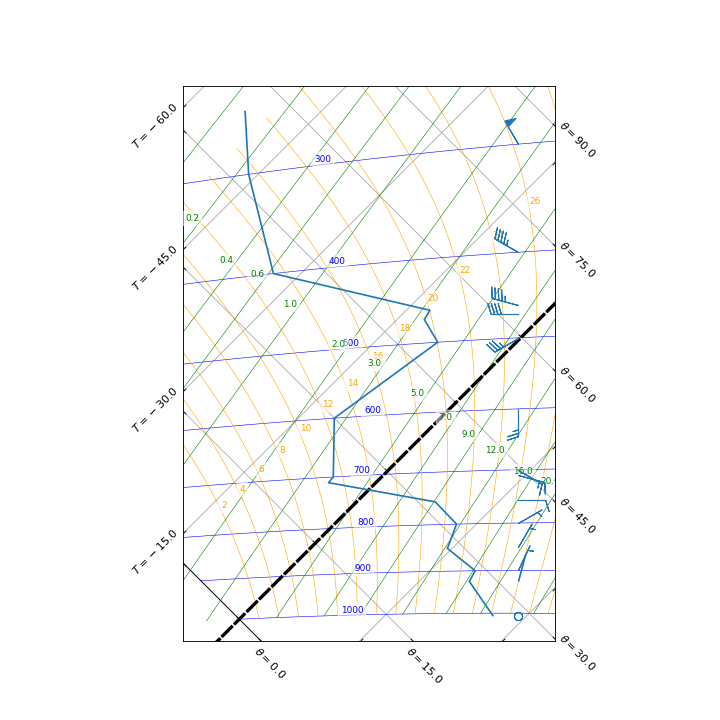
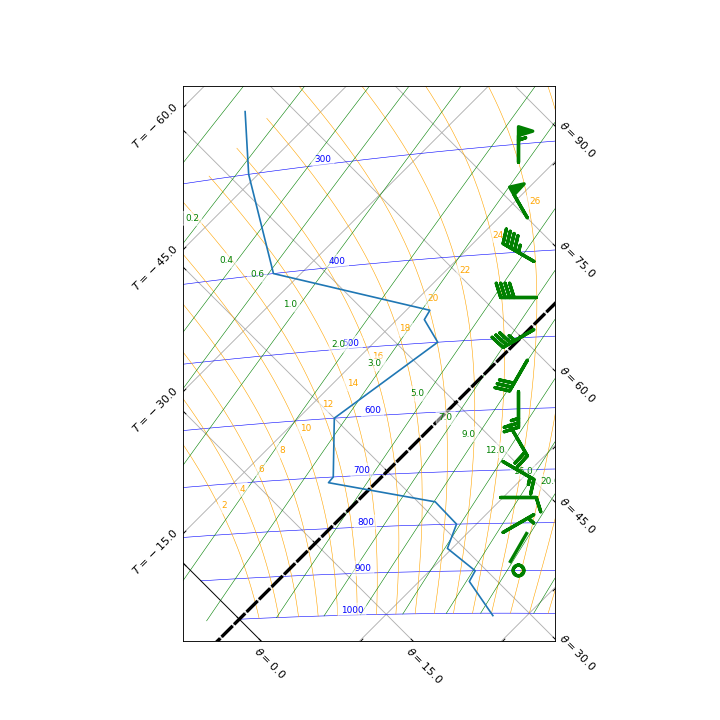
profile.barbs(barbs, gutter=0.9)
plt.show()
(Source code, png, hires.png, pdf)

The gutter keyword argument represents the proportion of the plot width that the barb gutter is offset from the right hand side axis. By default the gutter is set to 0.1.